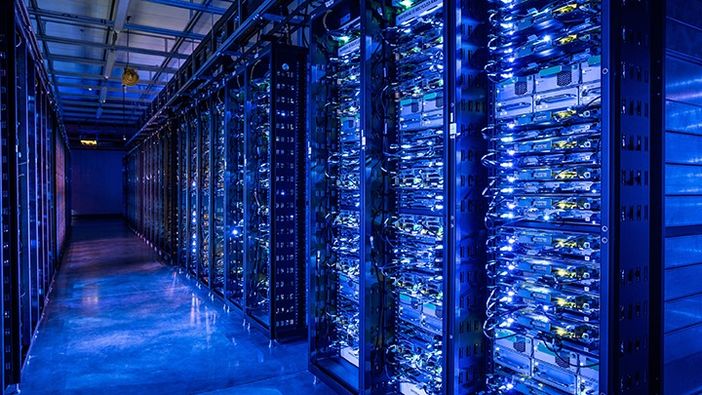
Data center optimization has always played an important role at Meta. By optimizing our data centers’ environmental controls, we can reduce our environmental impact while ensuring that people can always depend on our products.
With most other complex systems, optimization of energy consumption is a trial-and-error process. But experimenting on any component of a live data center is risky, as a single miscalculation could cause issues like power loss events. To help make sure our data centers are always performing at their best, we have developed a digital simulator that replicates the facilities’ cooling and thermal behavior. With our simulation, we can test control policies using either AI or model predictive control — a set of algorithms that interact with the model to predict a data center’s response to particular conditions. Unlike similar systems trained on historical data, our simulator accurately represents even the most extreme circumstances, including hypothetical scenarios, and it can make quantitative predictions for data centers that have not yet been built.
Model predictive control has proved to be a powerful optimization strategy in recent years, but it requires a highly accurate model of the system to be effective. For the best possible simulation, we have maximized the strengths of two different approaches. First, we developed a physics-based model — embedding it with equations that describe thermal processes relevant to our data centers — so that our simulator respects the principles of physics when representing new situations. We combined that method with statistical data science to leverage the knowledge we have gathered in our large fleet of data centers.
Why a physics-based thermal simulator?
Using measurements from the many sensors in our facilities, we can create numerical models that predict the energy consumption of the building. These models, although highly accurate, may not generalize well about situations outside the normal operating conditions reflected in the training data.
To quantify and visualize the fluid dynamics of our data centers, Meta works extensively with detailed physics-based models called computational fluid dynamics (CFD) simulations. We can study previously unseen conditions and designs with these models, but they demand a significant amount of computational power, and they take a long time to run.
Thermal simulators, or gray box models, open a realm of new opportunities beyond data science approaches and CFD. They solve thermal balance equations to describe the conditions in an individual room or even row in a facility, producing results quickly and with little input data. We can use the output to understand our data centers’ reactions to extreme weather conditions or to train a reinforcement learning algorithm, an AI system that finds the optimal solution through trial and error in a virtual environment.
Building a thermal simulator
Our dynamic model combines first-principle physics with building-modeling languages, including Modelica. To simulate a particular data hall, we first need static, site-specific details about the facility’s geometry, construction materials, and HVAC, as well as its system configurations and component efficiencies. Then we numerically re-create the control strategies (using the control Description Language) governing the behavior of all the HVAC and water equipment as functions of the indoor and outdoor conditions.
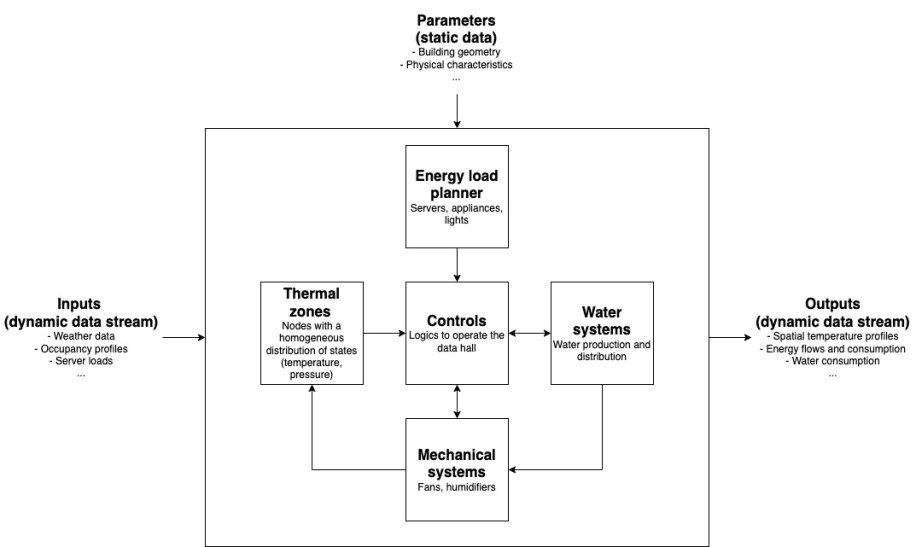
Once those tasks are complete, we can begin to input data. We choose variables whose impact we want to understand, such as temperature, energy, and water consumption, and we describe them as a time series.
Example case: A severe winter storm in Texas
Our data science–based models are typically very accurate when predicting a data hall’s thermal response to normal temperature ranges. But to keep our services running and avoid damage to hardware, we must also understand how data centers behave in extreme conditions that put water and power infrastructure under high stress. We don’t have the data necessary to train a data science–based model to represent severe cases, but a thermal simulator can mimic these situations and predict the effects of our response strategies.
To demonstrate the capability of our simulators, we studied the response of one of our data centers to a severe winter storm in Texas in February 2021. This unprecedented multi-day winter storm started with a 70˚F temperature swing, dropping the temperature below freezing for 10 days and reaching as low as -2˚F.
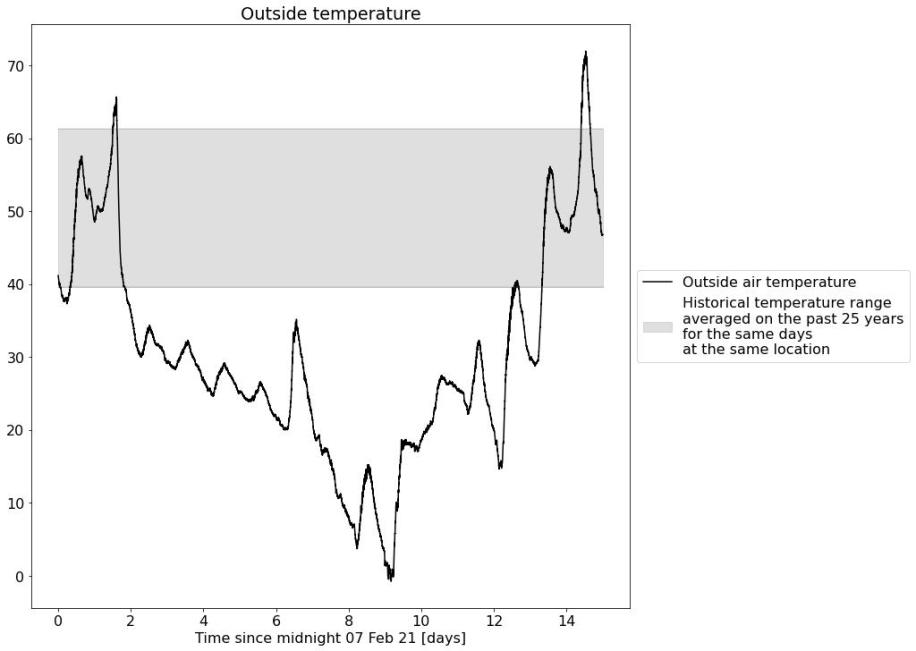
We input the conditions recorded at midnight on February 7, 2021, and then let our thermal simulator run on the time series of the following 15 days’ temperature set point, supply fan airflow, set point, and server load of the supply airflow entering the data hall. We did not add any operational data other than these four parameters.
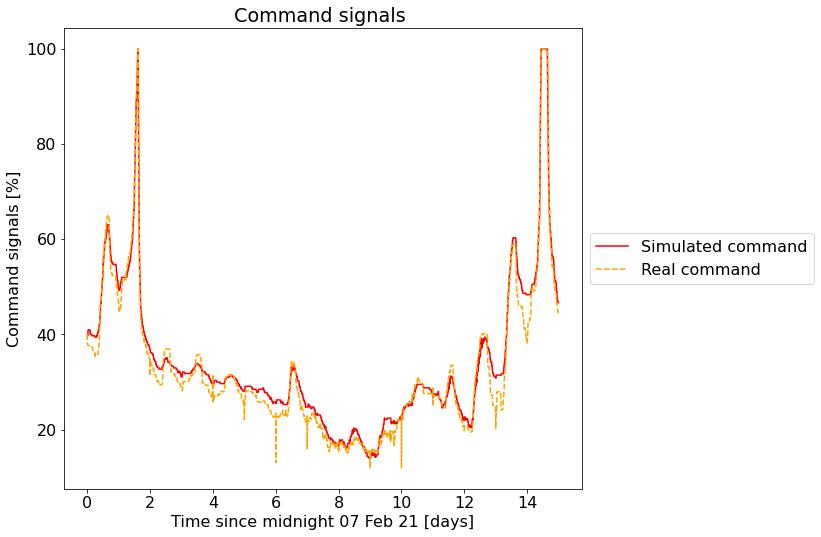
Below is the command of our HVAC economizer — which controls the mixing of hot and cold air — attempting to stabilize the data hall’s internal temperature. The signal varies from 15 to 100 percent, or nearly the full system range. The simulator was able to predict this behavior accurately.
It’s important to closely monitor the temperature of the supply air entering the data halls, which is affected by both the outside temperature and the heat from the server rooms. To simulate this variable, we must build a model of the full control loop (the command above is an example), mechanical equipment, and server room, using only physical principles, without fitting into sensor data.
The figure below shows the simulated and measured supply air temperatures relative to the temperature set point over the 15-day period we studied. We noted a mean absolute error (MAE) of 0.5˚F for the supply air temperature over the whole period. The MAE has a normal distribution centered at 0˚F (right panel), indicating no systematic bias or drift in our model for the 15-day period of predictive modeling. Additionally, our model accurately simulated the dynamics of the control system that regulates the temperature around the set point, as is particularly evident in the first and last days of this time span. Again, no operational data other than outside air conditions, temperature set point, supply fan airflow set point, and server load were entered in this simulation, demonstrating that the model was truly predictive in this extreme scenario.
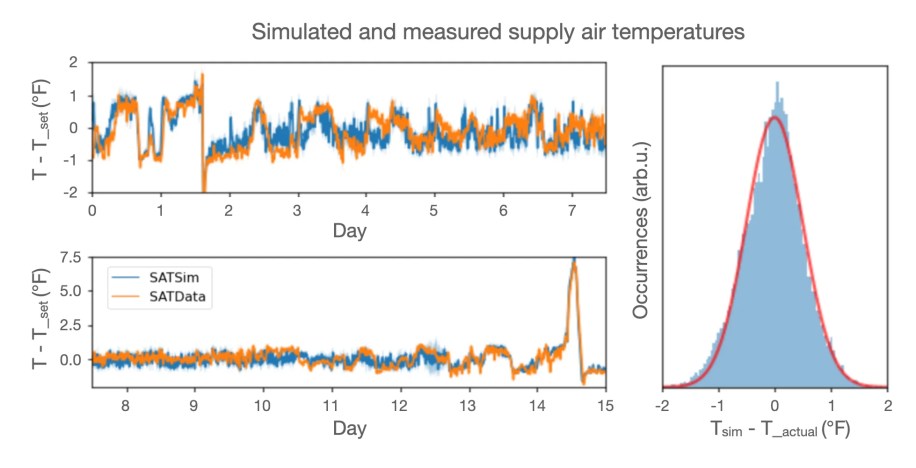
The supply air temperature was steady compared with the plunging temperatures outside, and our simulator also captured that accurately.
We have also validated the simulator on 24 random dates throughout 2021. Our simulator accurately modeled the data center’s response on these dates — which represented a wide range of weather conditions — achieving an MAE of 1.3˚F for the supply air temperature.
Future research for thermal simulation
According to the International Energy Agency, data centers consume about 1 percent of global electricity demand, contributing to 0.3 percent of all global CO2 emissions. In this context, Meta’s operational data centers have achieved net zero carbon emissions, are LEED Gold certified, and are supported by 100 percent renewable energy. They use 32 percent less energy and are 80 percent more water-efficient on average than the industry standard. Meta is committed to restoring more water than we consume by 2030, and we hope our simulator will help us continue to cut our resource consumption and ensure that our operations are resilient.
To conserve even more resources, the Physical Modeling Team at Meta is now training our simulator to predict and optimize our data centers’ energy and water consumption, so we can use it to optimize the control strategy and to test new facility and equipment designs. We also work closely with the data science and AI teams at Meta to couple these models with different machine learning methods, such as reinforcement learning, to predict the best set of operating points in real time. Additionally, we’re exploring other novel modeling approaches, combining recent advances in physical sciences and machine learning to find cross-functional approaches that will further improve the efficiency, reliability, and sustainability of our infrastructure.
