
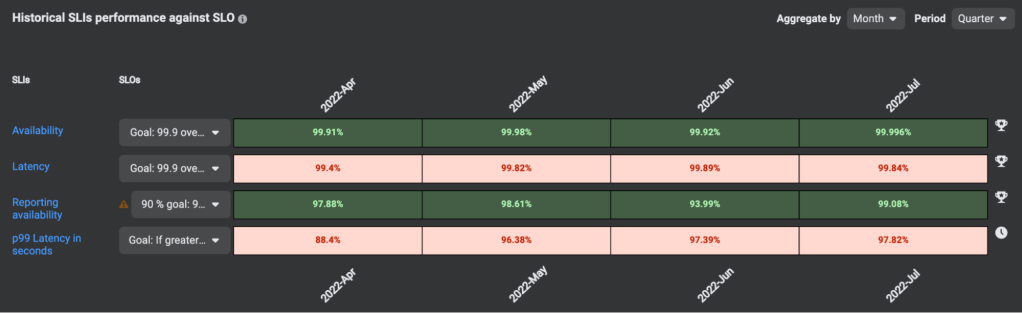
When we focus on minimizing errors and downtime here at Meta, we place a lot of attention on service-level indicators (SLIs) and service-level objectives (SLOs). Consider Instagram, for example. There, SLIs represent metrics from different product surfaces, like the volume of error response codes to certain endpoints, or the number of successful media uploads. Based on those indicators, teams establish SLOs, such as “achieving a certain percentage of successful media uploads over a seven-day period.” If SLOs are violated, it triggers an alert where respective on-call teams are notified to address the issue.
In a previous article, we covered SLICK, our SLO management platform that’s currently used by many services at Meta. Introducing SLICK allowed us to eliminate the discrepancies in how different teams tracked SLIs/SLOs. Through SLICK, we now possess a single source of SLO information and provide various integrations with existing Meta tooling.
Now, by leveraging historical data on SLO violations using SLICK, we’ve made it even easier for engineers to prioritize and address the most pressing reliability issues.
The difficulty identifying failure patterns
While we had big success introducing SLICK, after a time, it became evident that just tracking SLOs would not suffice. After discussions with other Meta engineers, the SLICK team discovered that service owners face difficulties in identifying the issues they need to address.
We wanted to make it easier for service owners to follow up on SLO violations and identify failure patterns and areas for improvement. That’s why SLICK should have a way to provide some actual guidance on how to improve the reliability of services. The key to creating these recommendations lies in analyzing past events that led to SLO violations. To better draw conclusions from these events, they should contain meaningful, structured information. Otherwise, people tend to remember the most recent or most interesting outages rather than the most common issues. Without a reliable source of information, teams might prioritize fixing the wrong problems.
Collaborative data annotations
Data tools at Meta, including SLICK, support the collaborative data annotations framework. This allows engineers to annotate datasets by attaching metadata (title, content, start time, end time, string key-value pairs, etc.) to them, and to visualize it across all other such tools.
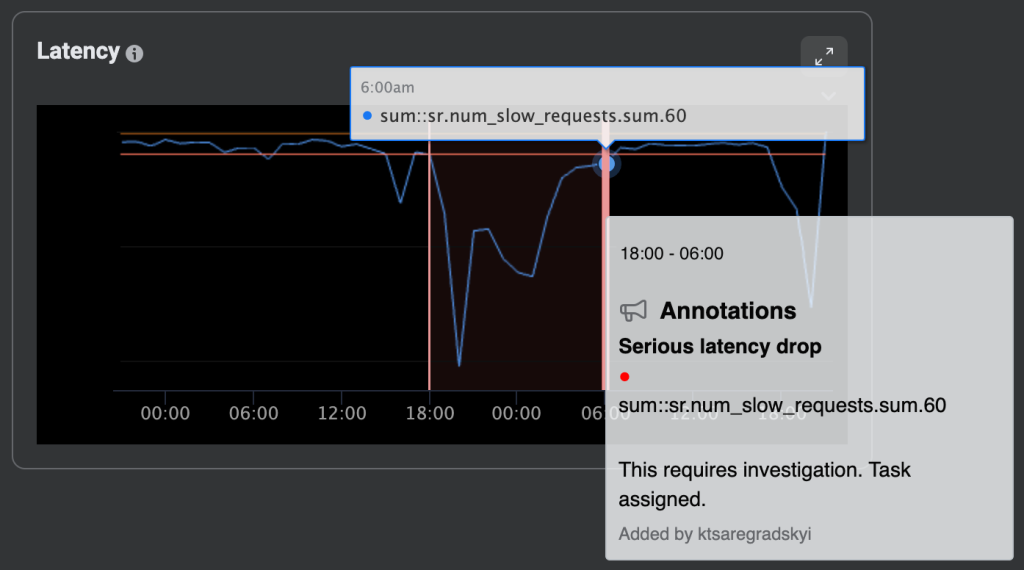
Naturally, some teams started to use this capability to annotate events that led to their SLO violations. However, there was no established way of looking at annotation data. Furthermore, service owners entered freeform data that wasn’t easily analyzed or categorized. Some people tried to use conventions, like putting a cause for the violation in square brackets in the title and building their own insights on top of this data. But these very team-specific solutions could not be applied globally.
Annotations in Instagram
Instagram stood out as one of the teams that felt the need for proper annotation workflows for their SLO violations.
Like many teams at Meta, Instagram has a weekly handoff meeting for syncing up on noteworthy events and communicating context for the incoming on-calls. During this meeting, the team will address major events that affected reliability.
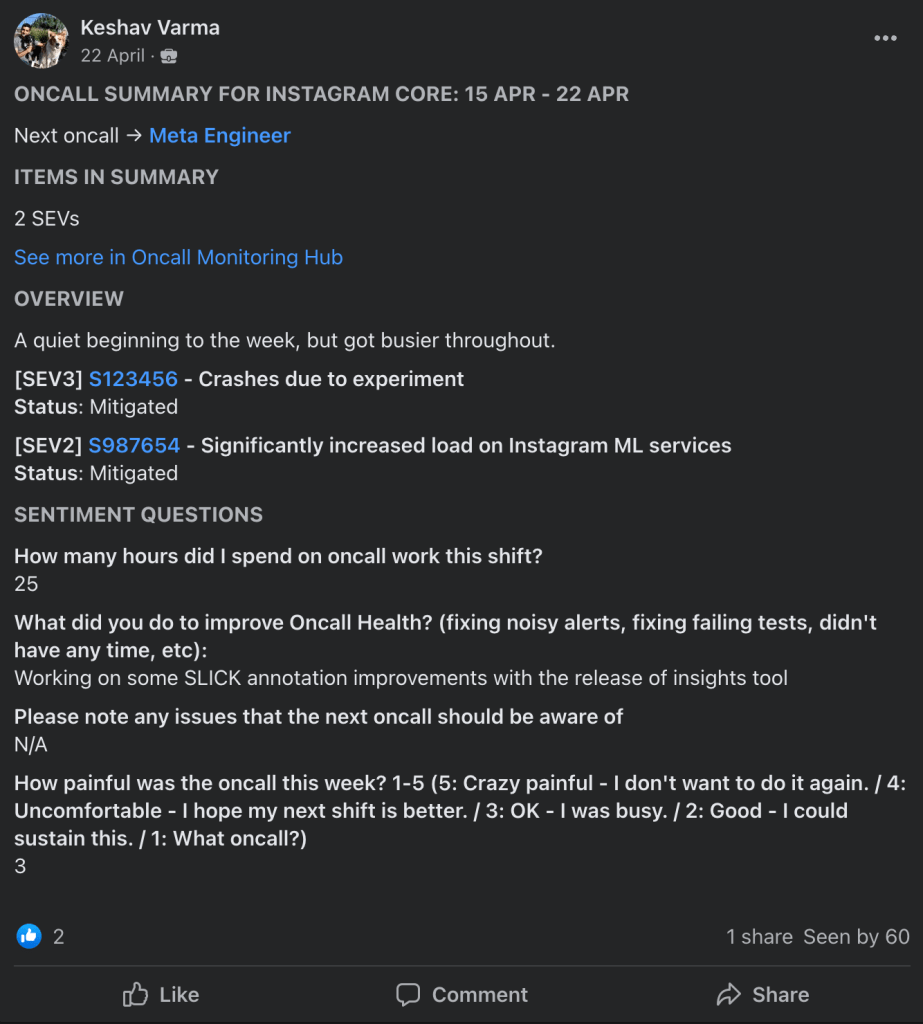
On-call engineers often navigate through busy on-call weeks. It’s not unusual to forget what actually happened during specific events over the course of such weeks by the time a weekly sync meeting occurs. That’s why the team started requiring on-calls to annotate any event that caused an SLO violation shortly after the event, by encoding it into their tooling and workflows. Then, as a part of the weekly on-call handoff checklist, the team ensured that all violations were appropriately tagged.
Over time, people started looking back at this data to identify common themes among past violations. In doing so, the team struggled with the lack of explicit structure. So they resorted to various string processing approaches to attempt to identify common words or phrases. Eventually, this led them to add a few additional fields in the annotation step to empower richer data analysis.
Using these richer annotations, they could generate more useful digests of historical SLO violations to better understand why they’re happening and to focus on key areas. For example, in the past, the Instagram team identified that they were experiencing occasional short-lived blips when talking to downstream databases. Since the blips lasted only a few seconds to a few minutes, they’d often disappeared by the time an on-call received an alert and started investigating.
Investigation rarely led to meaningful root-cause analysis, and on-call fatigue ensued. The team found themselves spending less effort trying to investigate and simply annotated the blips as issues with downstream services. Later on, they were able to use these annotations to identify that these short blips, in fact, acted as the biggest contributor to Instagram’s overall reliability issues. The team then prioritized a larger project to better understand them. In doing so, the team could identify cases where the underlying infra experienced locality-specific issues. They also identified cases where product teams incorrectly used these downstream services.
After practicing annotation usage for several years, the team identified a few elements that were to the success of this annotation workflow:
- The on-call already has a lot on their plate and doesn’t need more process. An easy way to create annotations should exist. The number of annotations directly relates to the value you can get. However, if creating annotations is too difficult, people just won’t create them.
- You must balance the level of depth in annotations with the amount of effort for an on-call. Ask for too much information and on-calls will quickly burn out.
- Team culture must reinforce the value of annotations. Furthermore, you have to actually use your annotations to build value! If you ask people to create annotations but don’t prioritize projects based on them, people won’t see the value in the whole process. As a result, they’ll put less and less effort into creating annotations.
Introducing schema for annotations
Naturally, as the Instagram team adopted SLICK, they sought to extend the learnings they’ve made in collecting annotations to the rest of Meta. Instagram and SLICK worked together to settle on a flexible data structure that allowed other teams to customize their workflow to meet their specific needs. This collaboration also provided common elements to make the annotation process a unified experience.
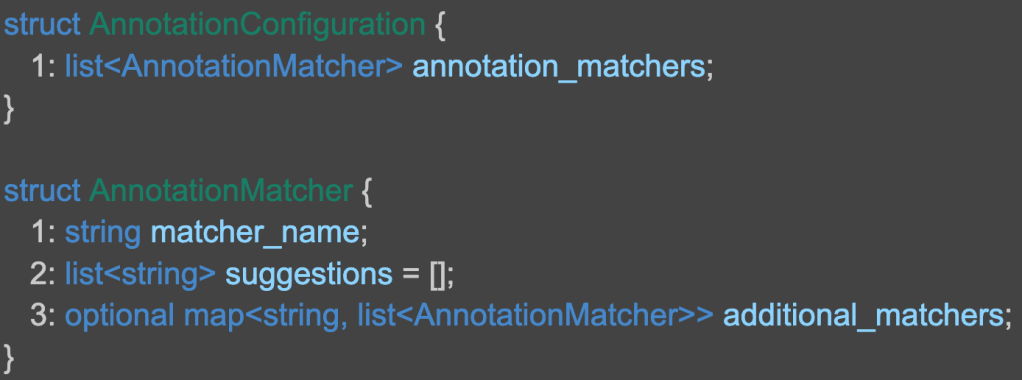
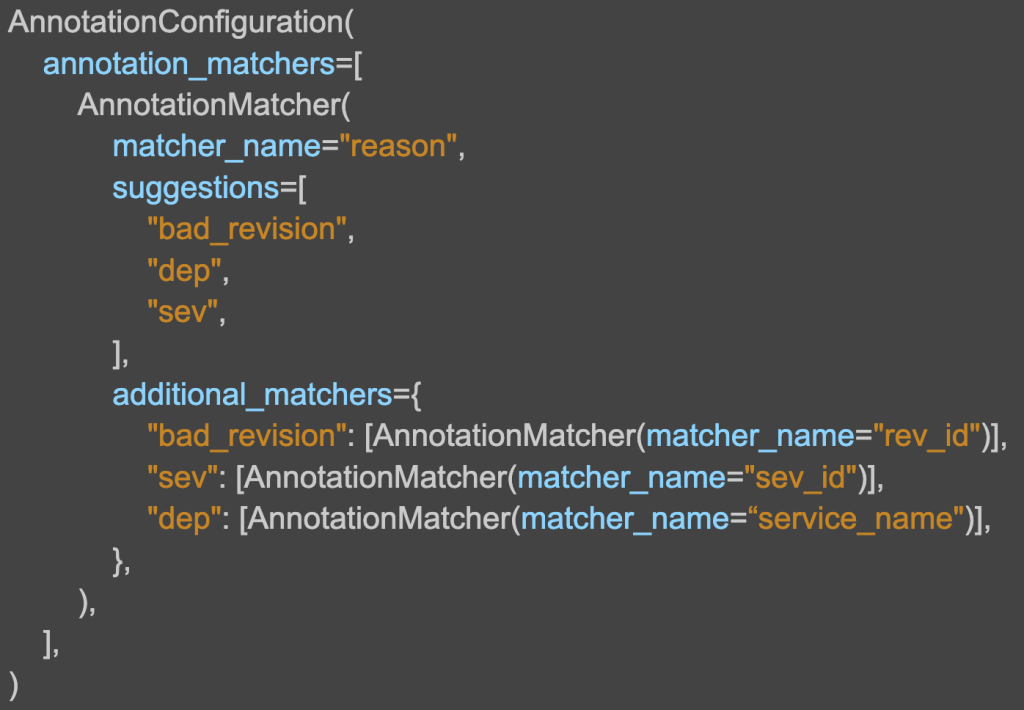
To achieve this, the team introduced an additional field in the SLI configuration: annotation_config. It allows engineers to specify a list of matchers (key-value pairs associated with the annotation) that need to be filled in when an annotation is created. Each matcher can have extra matchers that will need to be filled in, depending on the value of the parent matcher. This structure allows for defining complex hierarchical relations.
Ways to create schematized annotations
Once the schema was ready, we needed a way to enter data.
Manual annotations via SLICK CLI
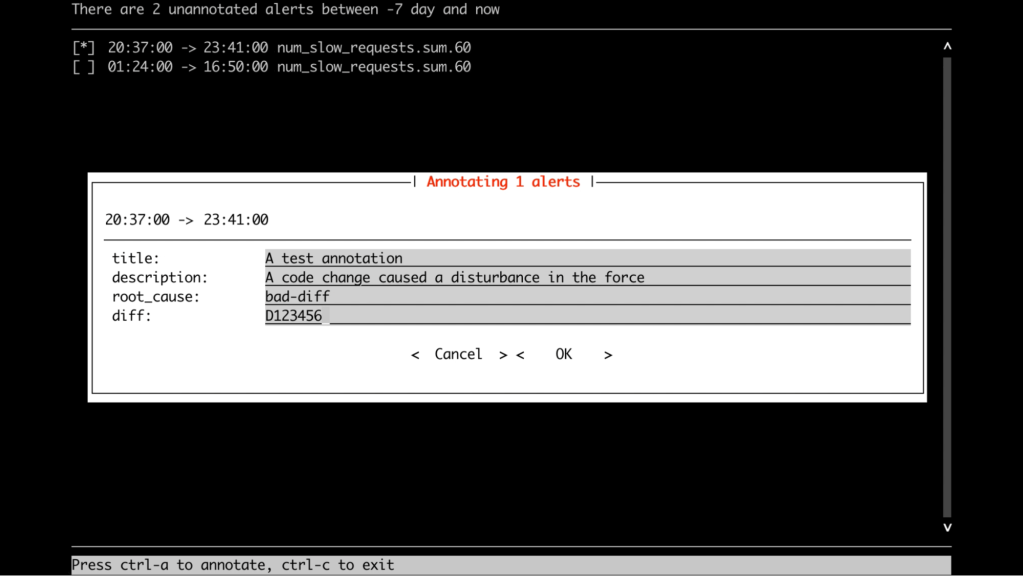
SLICK’s tool offering contains a CLI, so it was natural to have this capability there. This was the very first way to create annotation metadata according to the schema. The CLI provides a nice interactive GUI for people who prefer the terminal rather than a web interface.
Manual annotations via SLICK UI
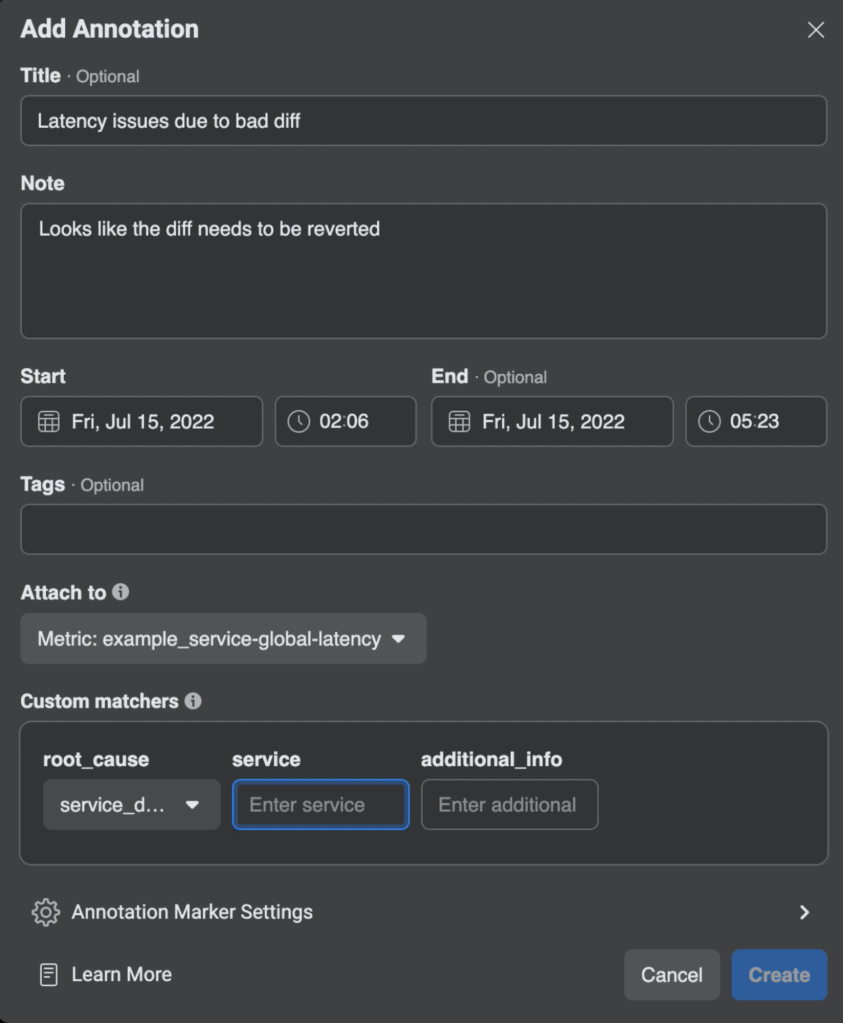
Many users prefer to use the UI to create annotations because it provides a good visual representation of what they are dealing with. The default annotations UI in SLICK didn’t allow for adding additional metadata to the created annotations, so we had to extend the existing dialog implementation. We also had to implement the schema support and make sure we’re dynamically displaying some of the fields, depending on user selection.
Manual annotations via Workplace bot
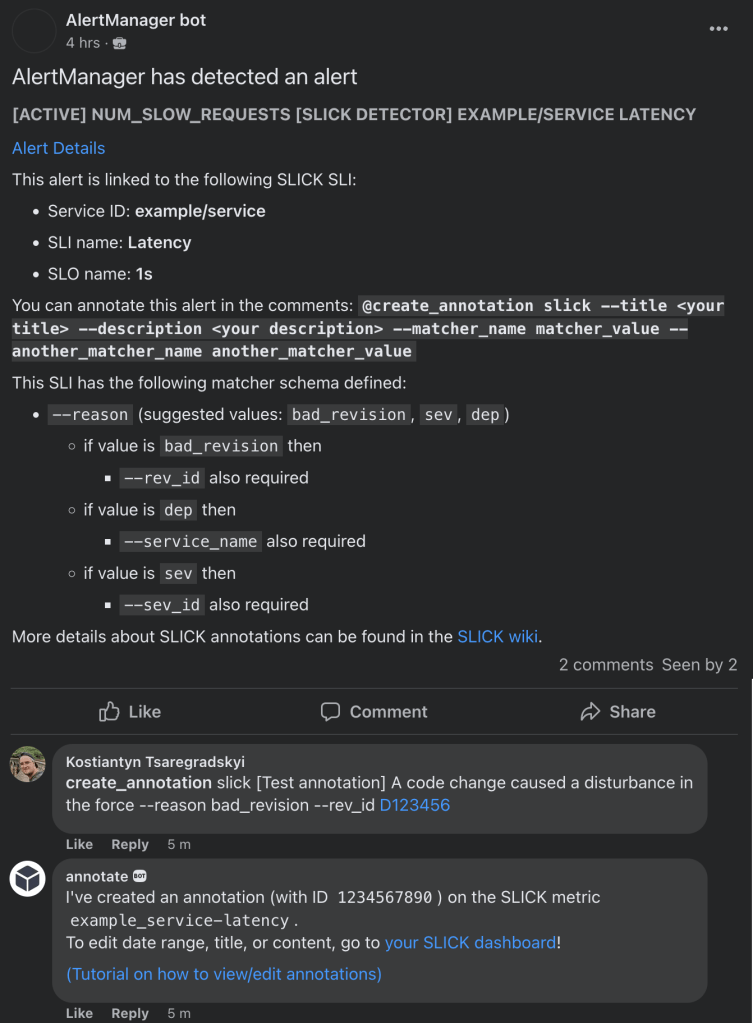
Many of SLICK’s users use a Workplace bot to receive notifications about events that led to SLO violations as a post in their Workplace groups. It was possible to annotate these events right from Workplace before. For many teams, this became the preferred way of interacting with alerts that led to SLO violations. We’ve extended this feature with the ability to add extra metadata according to the schema.
Automated annotations via Dr. Patternson–SLICK integration
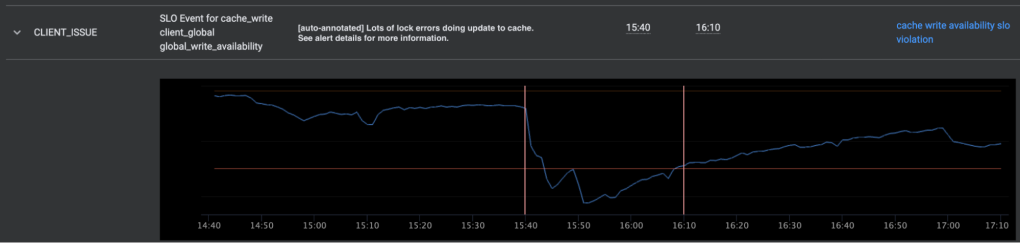
Meta has an automated debugging runbooks tool called Dr. Patternson. It allows service owners to automatically run investigation scripts in response to an alert. SLICK has integration with this system — if the analysis has conclusive results and is capable of figuring out the root cause of an event that led to SLO violation, we annotate the alert with the determined root cause and any additional data that the analysis script provided.
Of course, not all problems can be successfully analyzed automatically, but there are classes of issues where Dr. Patternson performs very well. Using automated analysis greatly simplifies the annotation process and significantly reduces the on-call load.
Annotations insights UI
After having various workflows for people to fill in their information, we could build an insights UI to display the aggregated information.
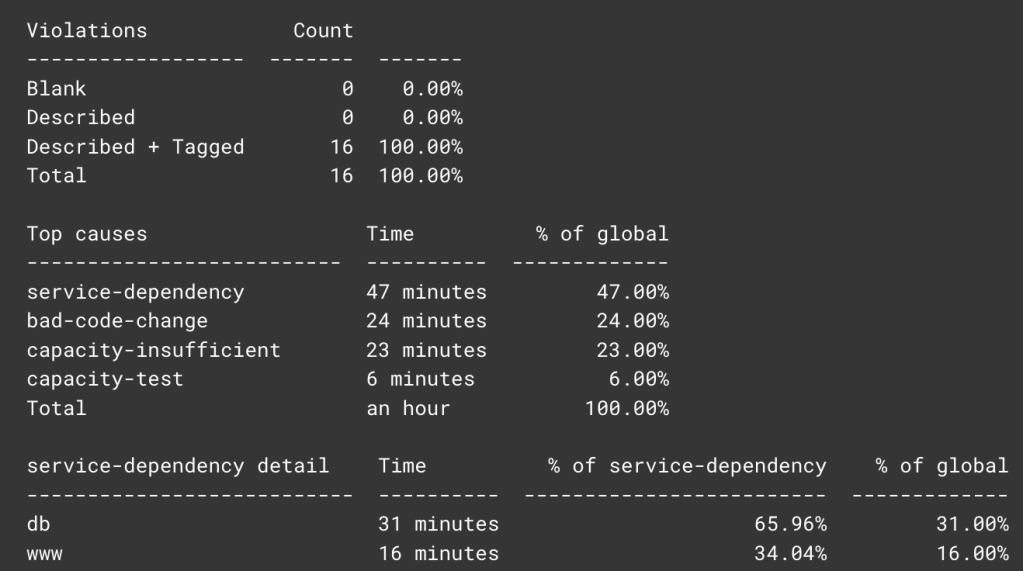
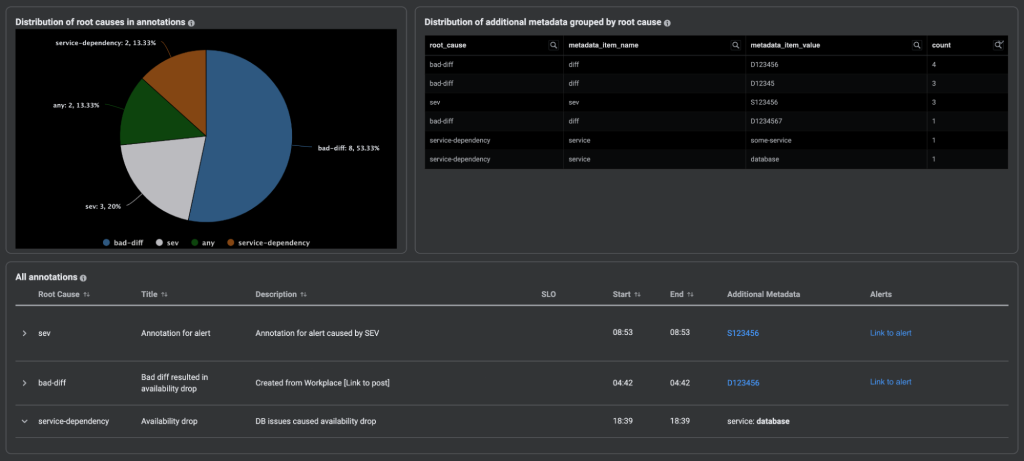
We’ve built a new section in the SLICK UI to display annotations grouped by root cause. By looking at this chart for a specific time range, service owners can easily see the distribution of root causes for the annotations. This clearly signals that some particular issue needs to be addressed. We’re also showing the distribution of the additional metadata. This way, SLICK users can, for example, learn that a particular code change occurred that caused multiple alerts.
We’re also showing the list of all annotations that happened in the specified time period. This allows engineers to easily see the details of individual annotations and edit or delete them.
Takeaways and next steps
These new features are currently being tested by several teams. Feedback we’ve received already indicates that the annotation workflow resulted in a big improvement for people working with SLOs. We plan to capitalize on this by onboarding all SLICK users and building even more features, including:
- Switching from just displaying the results to a more recommendation-style approach, like: “Dependency on service ‘example/service’ was the root cause for the 30 percent of alerts that led to SLO violations for SLI “Availability”. Fixing this dependency would allow you to raise your SLI results from 99.96% to 99.98%.”
- Adding the ability to exclude some particular annotated time periods from SLO calculation (e.g., a planned downtime).
- Analyzing annotations’ root causes across all SLIs (currently we support analysis on the individual SLI level).
The work that we’ve done so far will form the basis for a formal SLO review process that the team will introduce in the future. We hope to shift teams’ focus from just reacting to SLO violations on an ad-hoc basis to a more planned approach. We believe that annotating events that led to SLO violations and regular periodical SLO violation reviews may become a standard practice at Meta.


