We would like to thank Peter Tang for all his work on SLICK, and for helping us write this post!
To support the people and communities who use our apps and products, we need to stay in constant contact with them. We want to provide the experiences we offer reliably. We also need to establish trust with the larger community we support. This can be especially challenging in a large-scale, quickly evolving environment like Meta, with thousands of engineers frequently deploying code, prototyping features, and iterating over changes. We need to have clear expectations for each product, feature, and service. With these, we can better visualize the desired experience for the people using our services and analyze any bottlenecks or complex interactions between our systems.
We started looking at service-level indicators (SLIs) and service-level objectives (SLOs) as a way to set expectations and measure performance of services against those expectations. To provide tooling support for this, we built SLICK — a dedicated SLO store. With SLICK, we are able to centralize SLI and SLO definitions to easily find and understand another service’s reliability; provide service owners with insights using high-retention, full granularity data for key service metrics not found in other tools; and integrate SLOs with various other workflows at the company to ensure that SLOs become a part of day-to-day work.
Before SLICK, SLOs and other performance metrics were stored in custom dashboards, documents, or other tools. If you wanted to locate a team’s SLOs, it could take an hour of searching or asking people to find something. In addition, our previous systems didn’t retain these metrics at full granularity for more than a few weeks. This made it nearly impossible to analyze an SLO over longer periods of time. With SLICK, we are now able to:
- Define SLOs in a unified way for our services
- Have up to per-minute granularity metric data with up to two years of retention
- Have standard visualizations and insights for SLI/SLO metrics
- Send periodic reliability reports to internal groups, allowing teams to use them for reliability reviews
Discoverability
SLICK defines a standard model, which enables everyone in the company to speak the same language when it comes to reliability. This makes it seamless for new service owners to follow company-wide standards. It also lets them think about service expectations at the early stages of inception and design of the service.
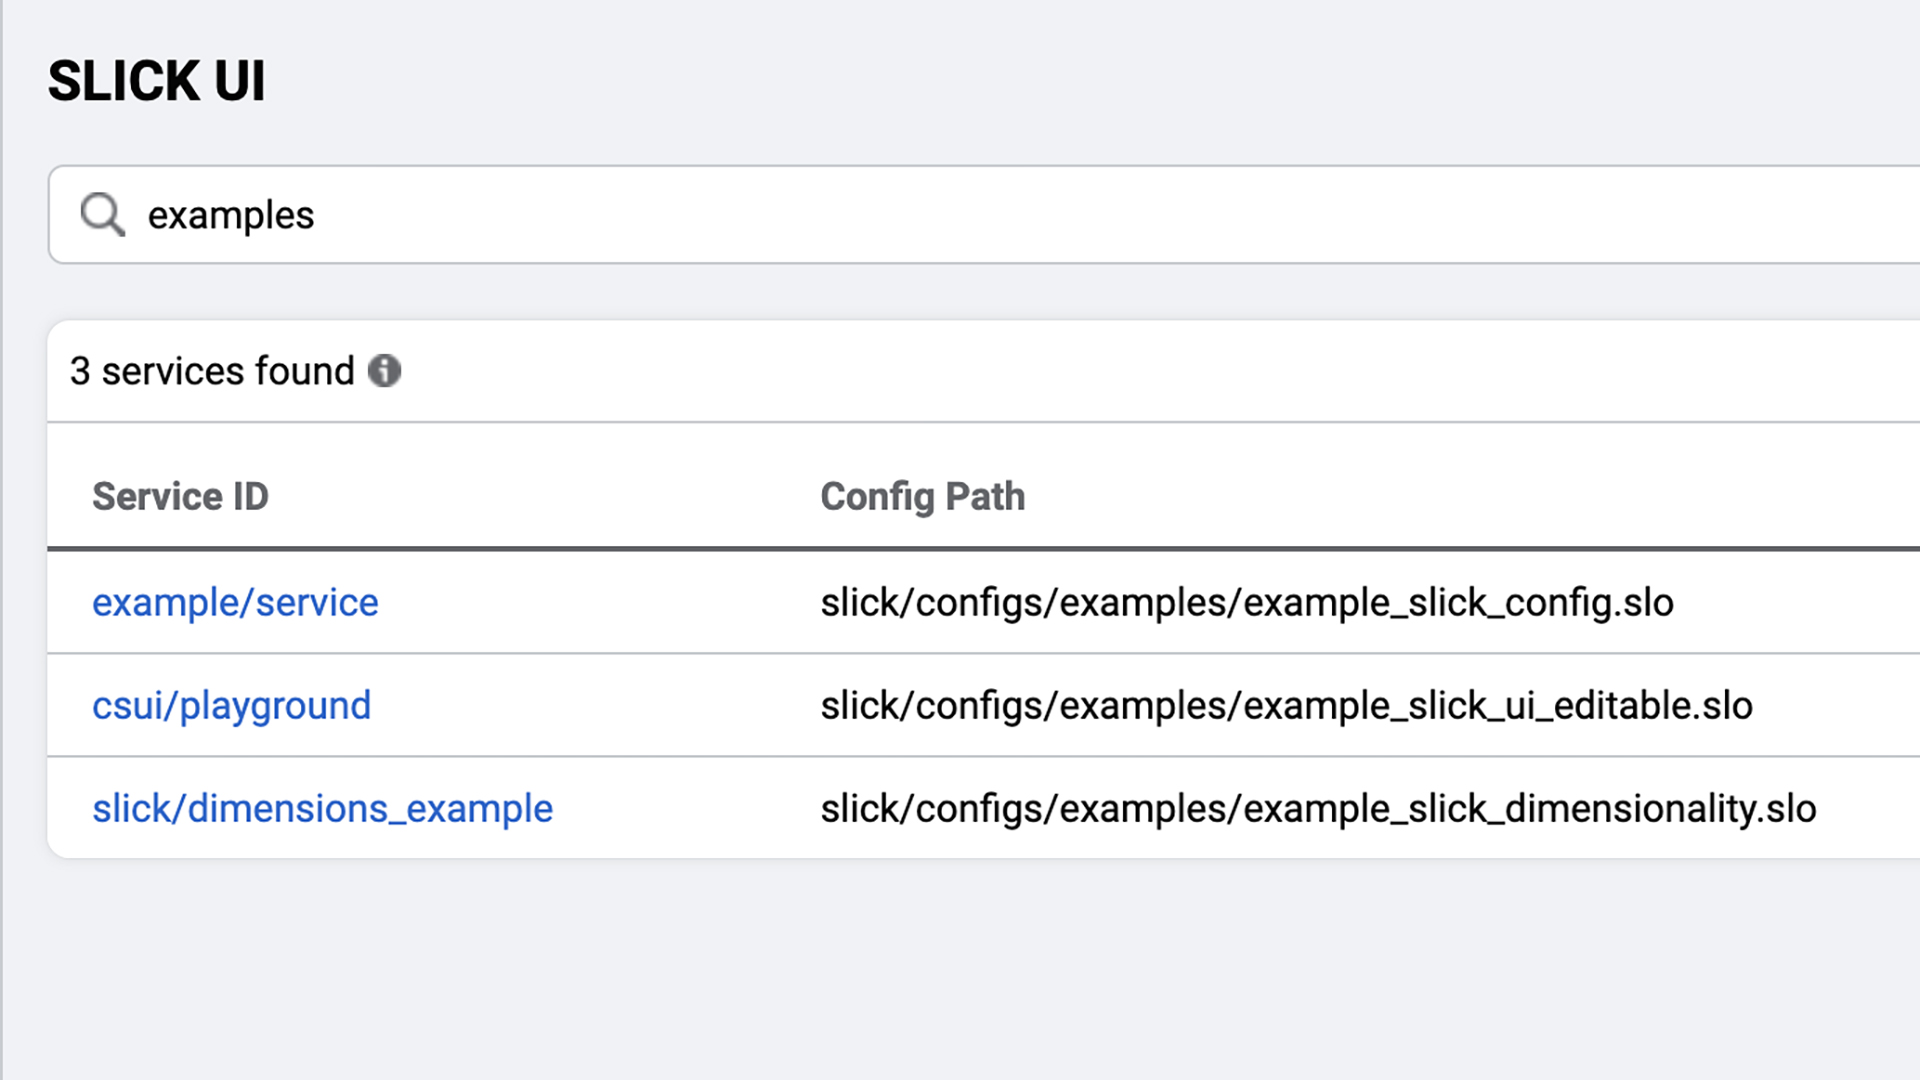
SLICK can help us locate metric and performance data regarding the reliability of a specific service just by knowing its name. It does this by building an index of onboarded services that link to dashboards with standard visualizations to analyze and assess the service reliability. So, with a single click, it becomes possible to know whether a service currently meets or doesn’t meet user expectations. We can then start asking why.
Long-term insights
Questions about service reliability can be extremely complex. In some cases, a single bad deployment or piece of code can make a service suddenly regress. While in other cases, small, incremental changes could creep in as the service evolves.
SLICK allows service owners to consume full granularity metric and performance data with up to two years of retention. The storage process in SLICK occurs periodically via a data pipeline that runs every hour, capturing all of the SLI time series’ data and storing them in a sharded MySQL database. The system then analyzes these to form consumable insights. This enables everyone — from engineers to TPMs to leadership — to understand trends over time that might reveal a regression in service reliability that otherwise might go unnoticed.
Workflows
To amplify the value and help us use new long-term insights to drive decision-making, SLIs and SLOs need to be in a language everyone understands and uses while planning and assessing impact. To enable this, we have integrated SLOs into common workflows.
When a large-scale incident happens, service owners can evaluate side-by-side how it affected overall user experience. They can do so by looking at SLOs in our on-call tooling. On the flip side, we can also use SLOs to drive the process of declaring when a large incident has occurred. We initiate this by using SLOs as criteria for incidents within the company. Many of our systems use these criteria to get alerted about problems that their users see.
In essence, integrating SLIs and SLOs into other tooling creates easy pathways to onboard onto SLICK (for a service not yet onboarded) or to get effective insights in accessible and easy-to-consume ways.
SLICK onboarding
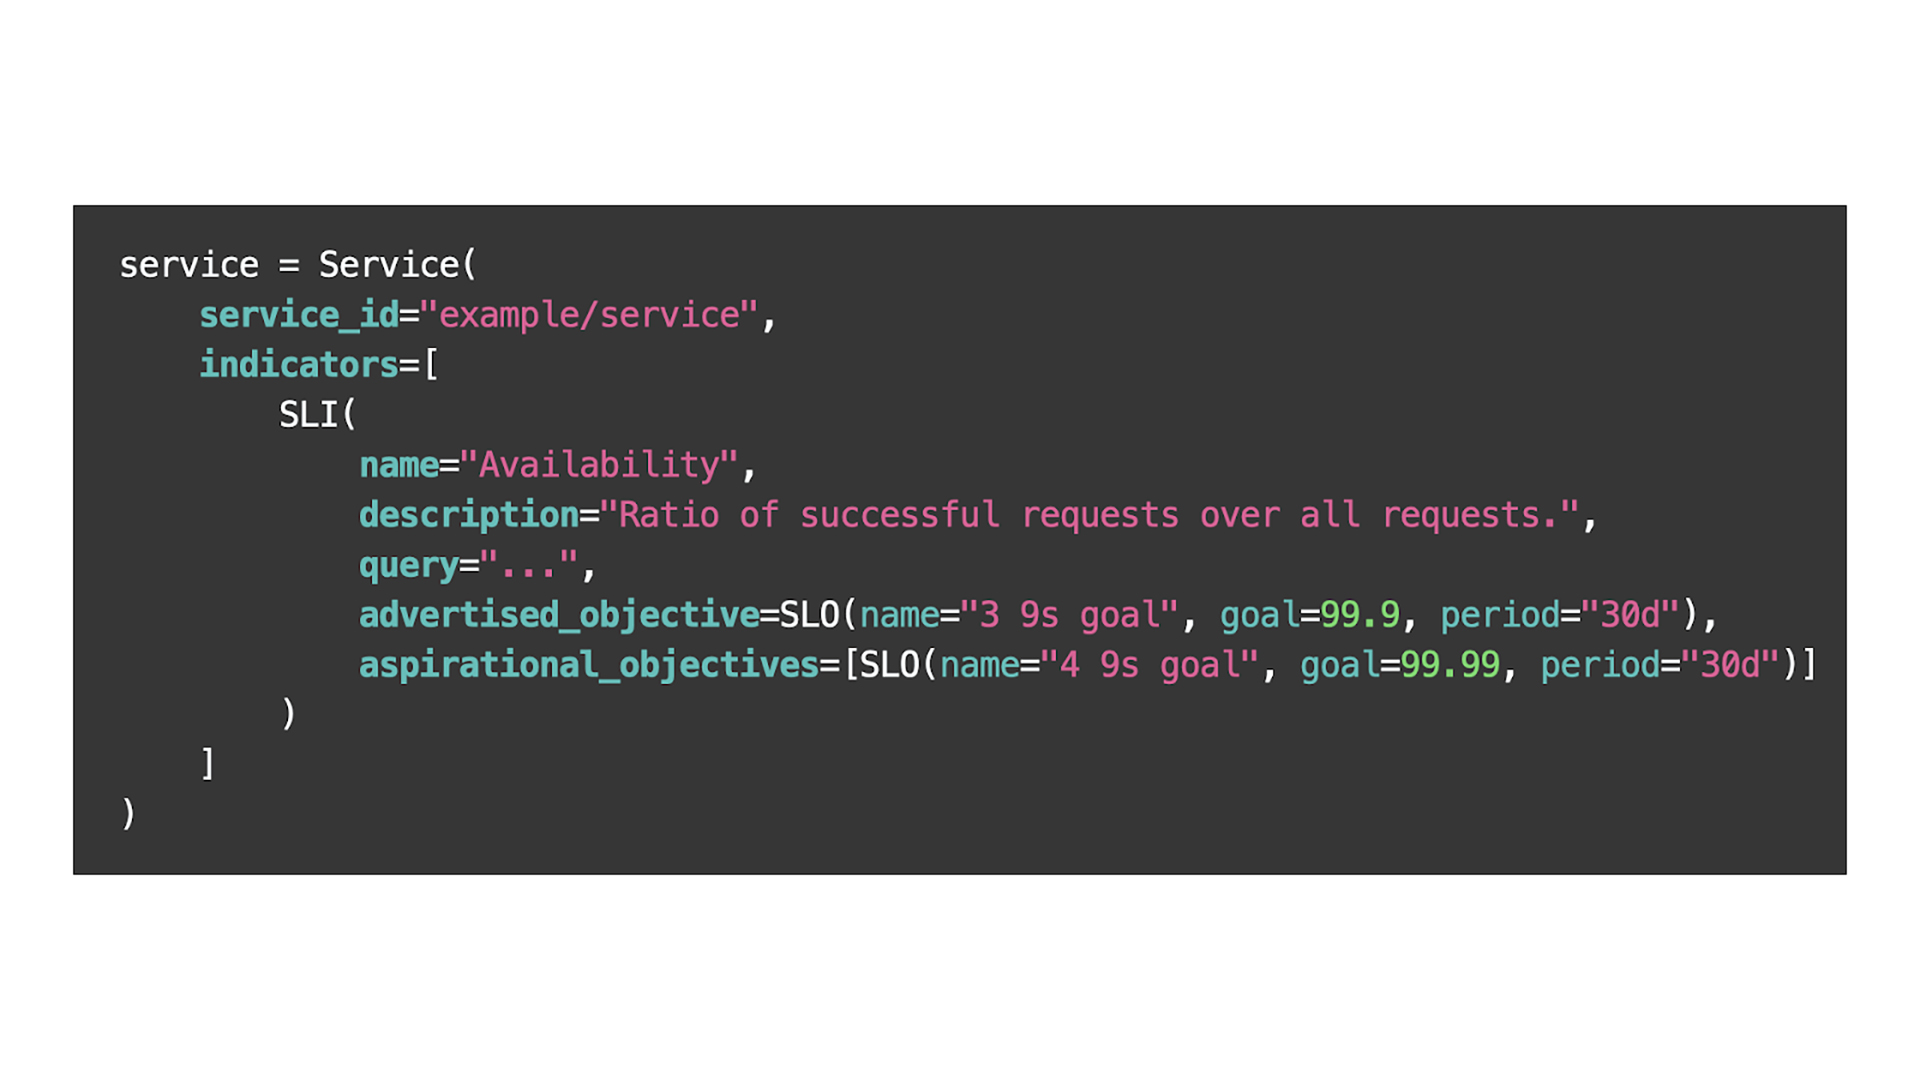
Our service owners onboard to SLICK by using an editing UI or by writing a simple configuration file, which follows a DSL with information such as the name of the service, and queries for the SLI time series along with the respective SLOs.
Using SLICK
1) Dashboards
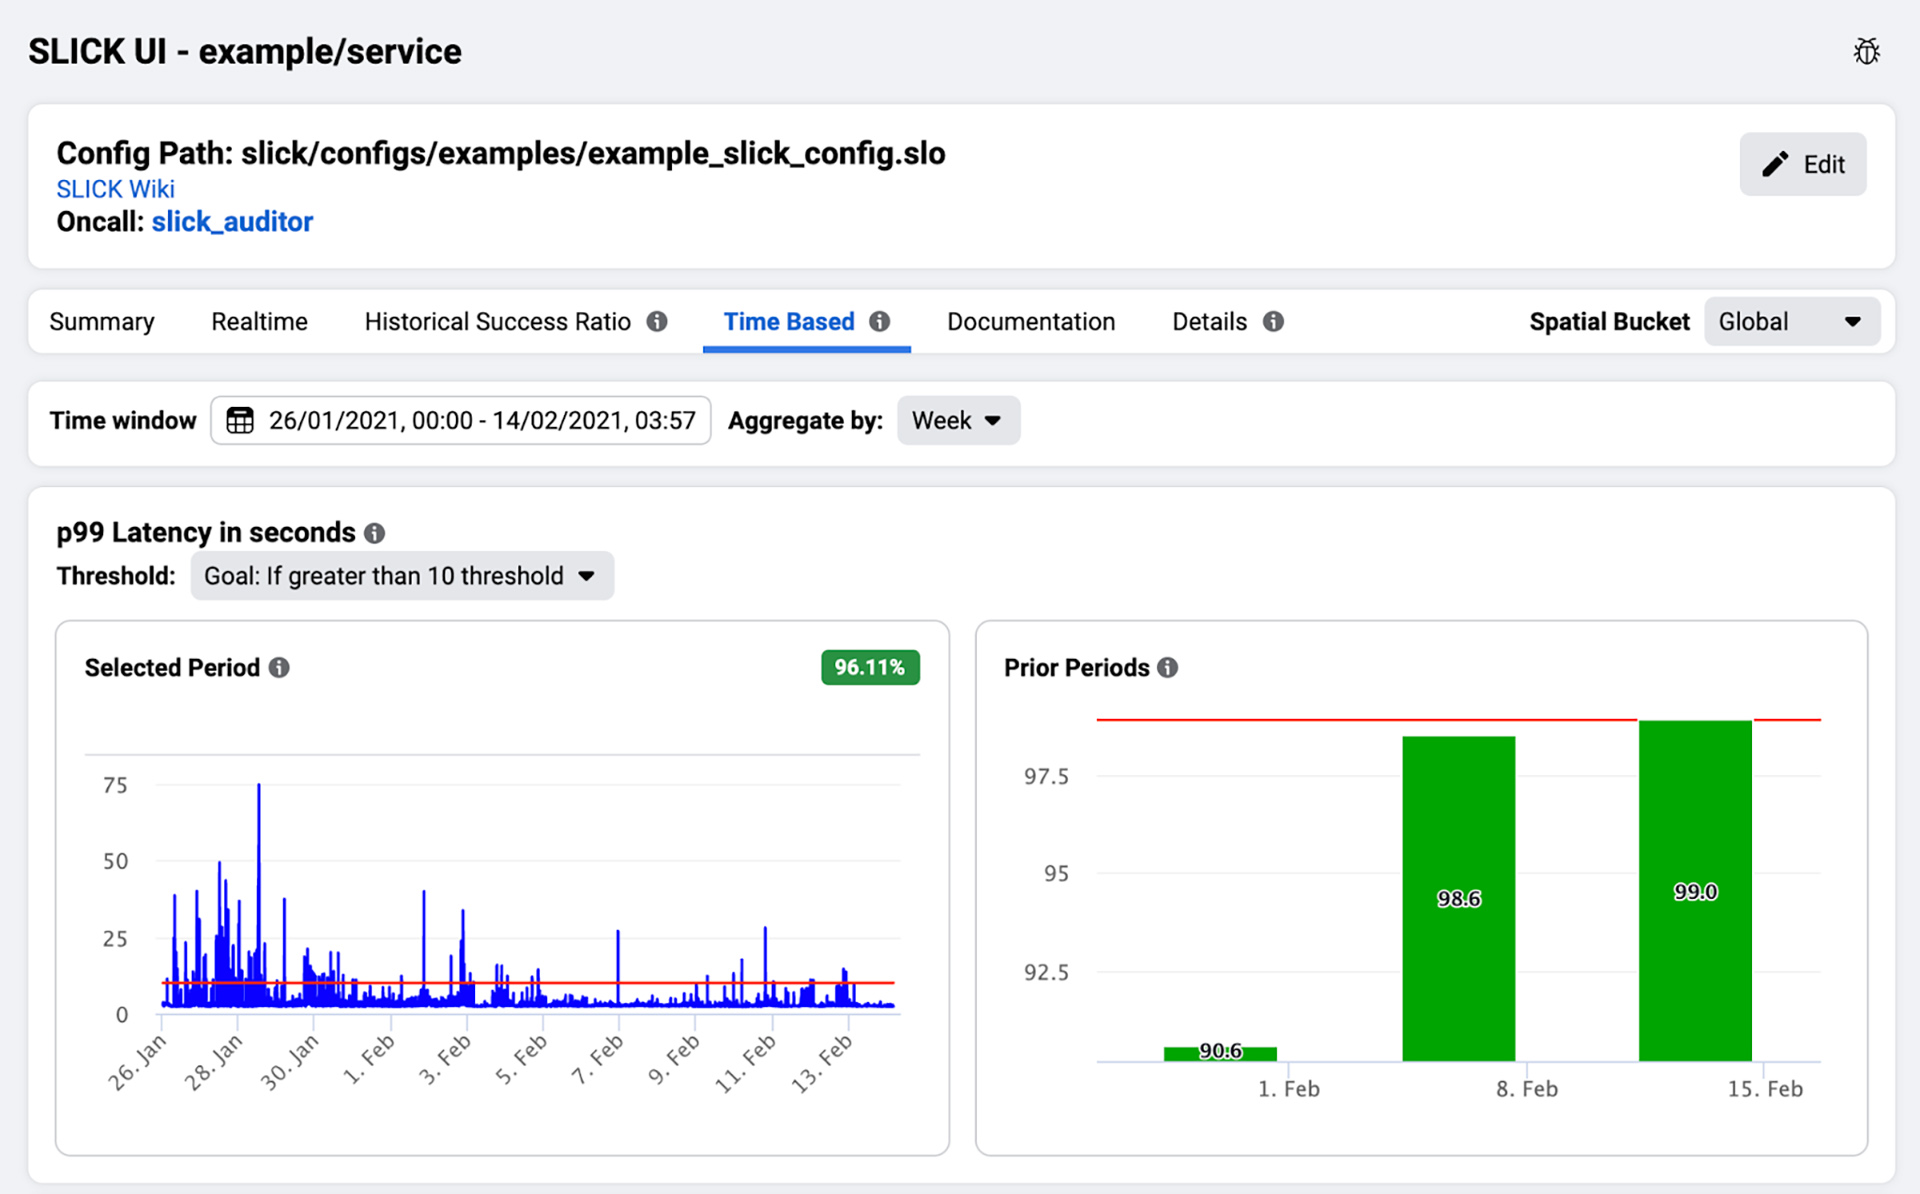
SLICK dashboards provide service owners with the ability to monitor real-time SLI data as well as historical trends based on high-retention, long-term data.
2) Periodic reports
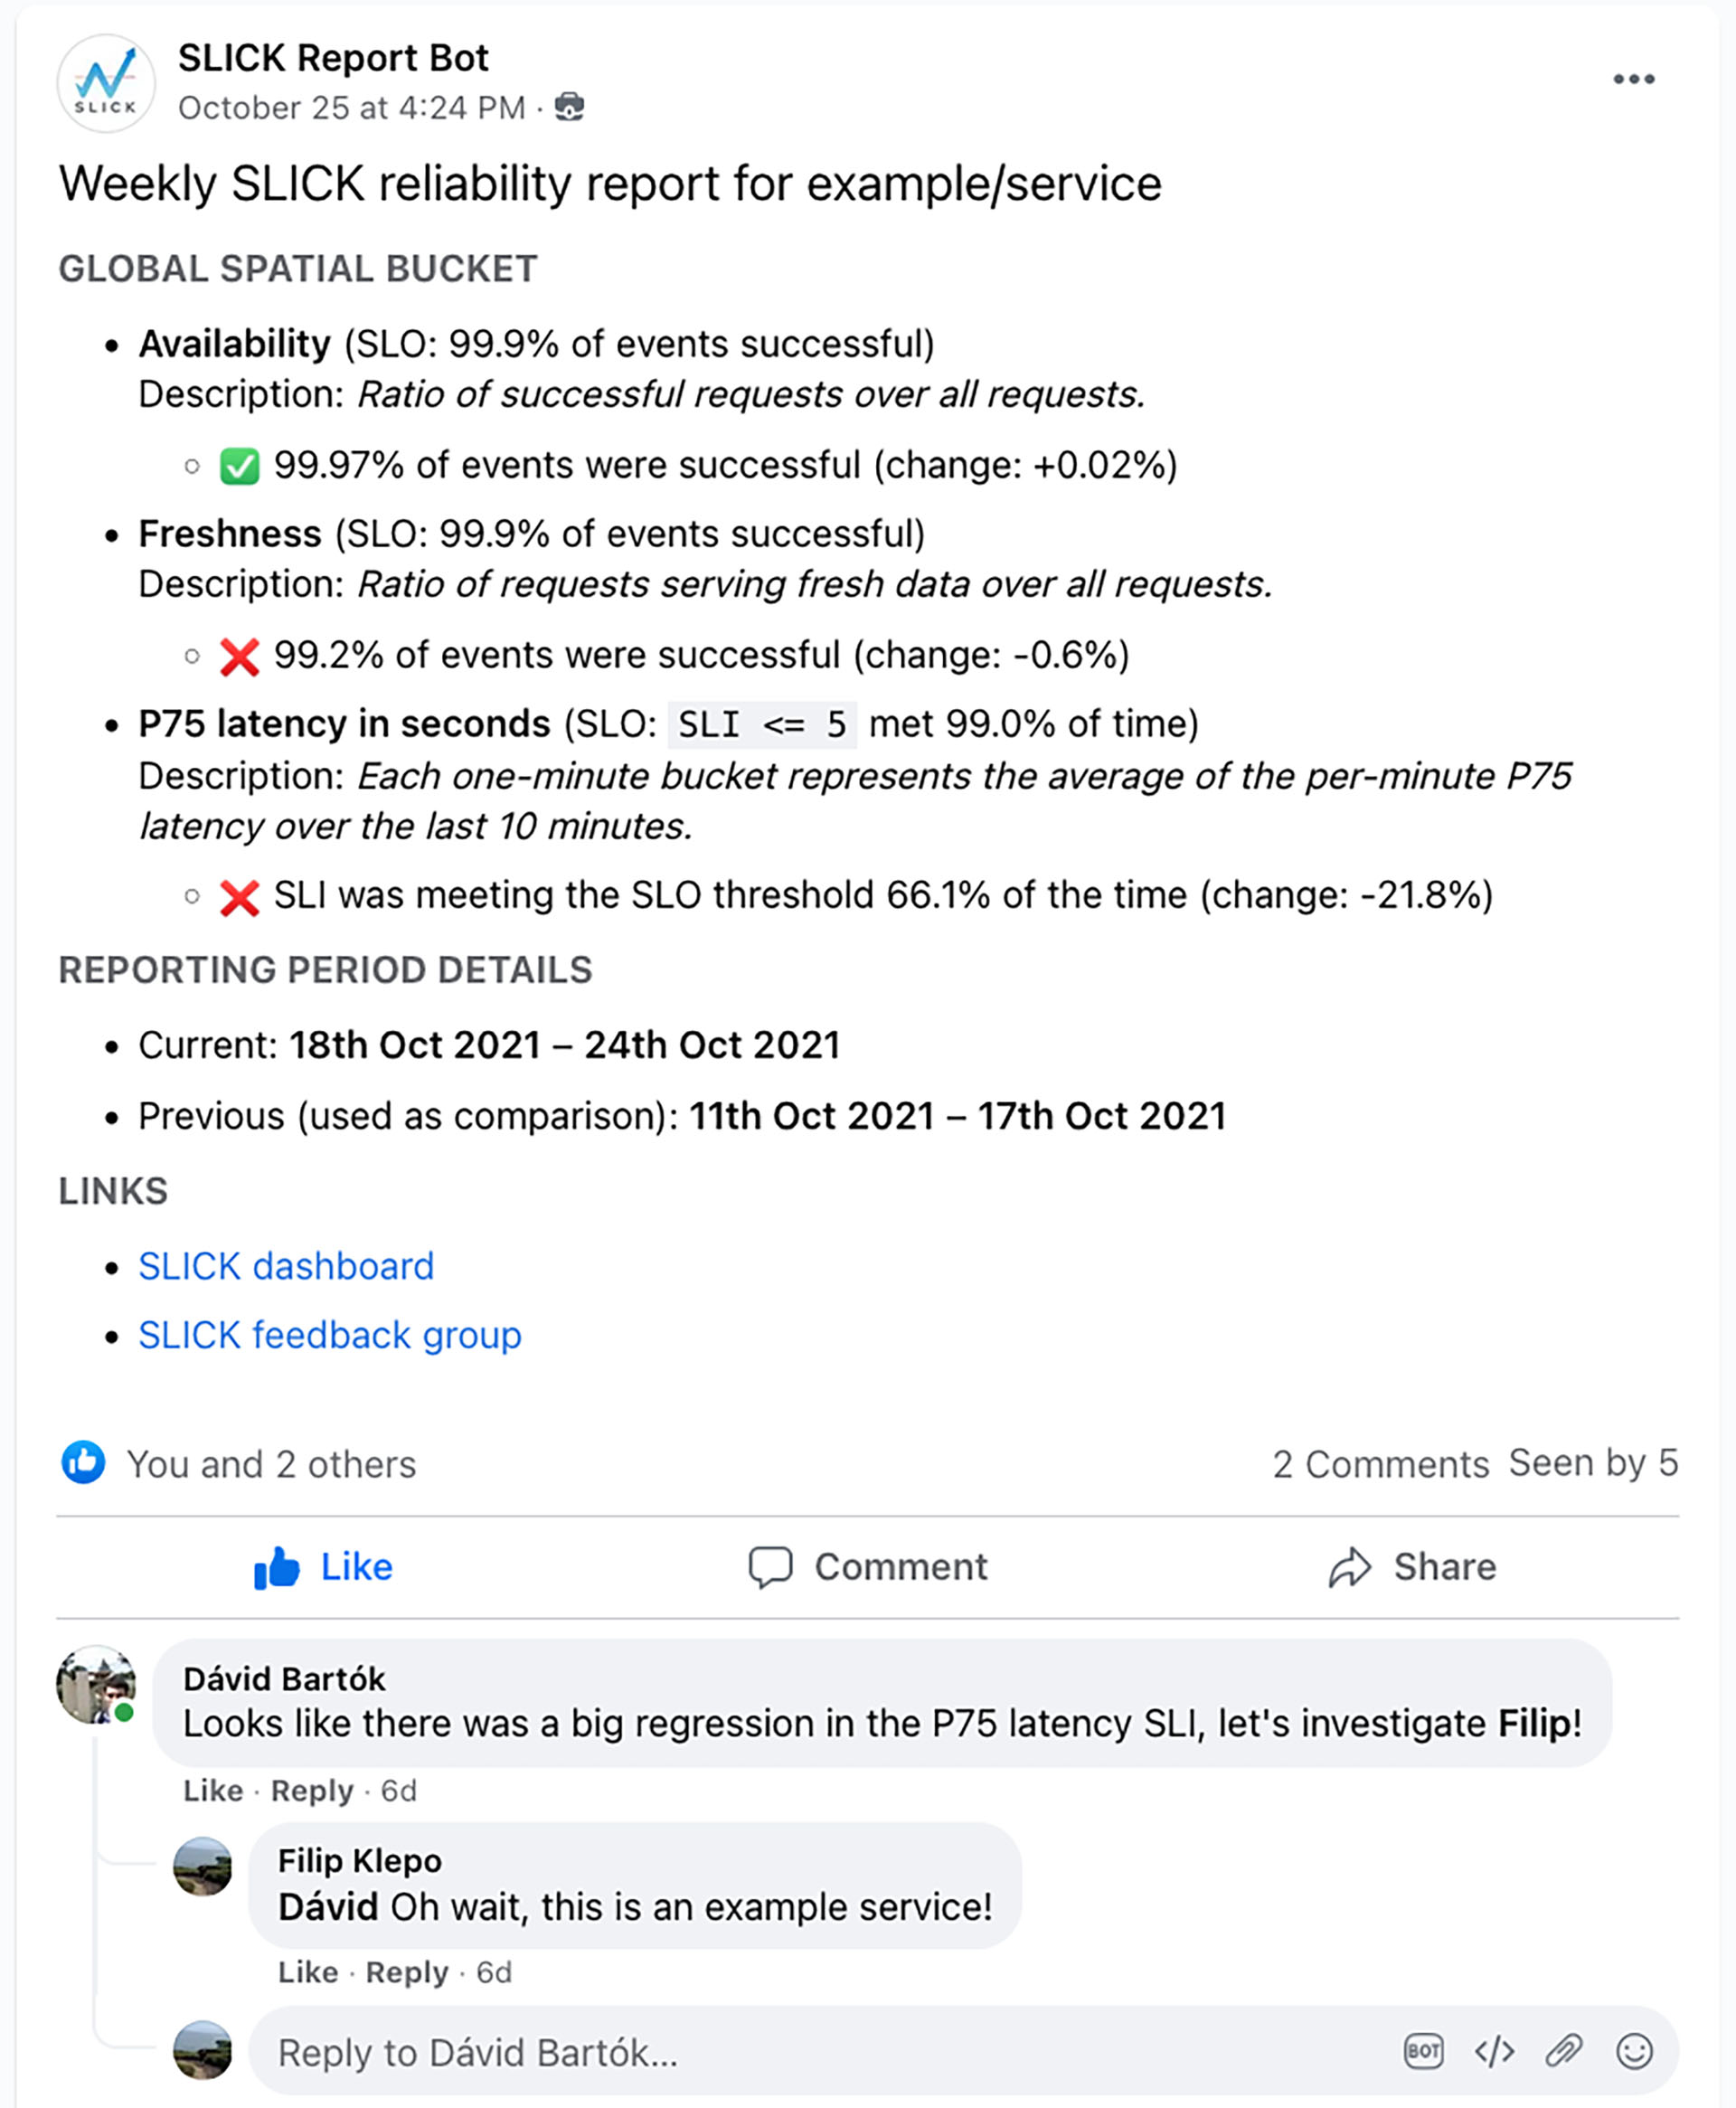
SLICK provides engineers with the ability to receive reports with summaries of their SLO performance. These reports get posted periodically to internal groups. The reports serve as an easy way for service owners to keep an eye on regressions and conduct retrospectives. We’ve often seen service owners brainstorm about reliability in the comments of these posts.
3) CLI
SLICK provides a command line interface that enables service owners to perform a few operations, such as backfilling data, generating a report on demand, or testing the effect of changes on SLICK configs.
SLICK architecture
Overall architecture
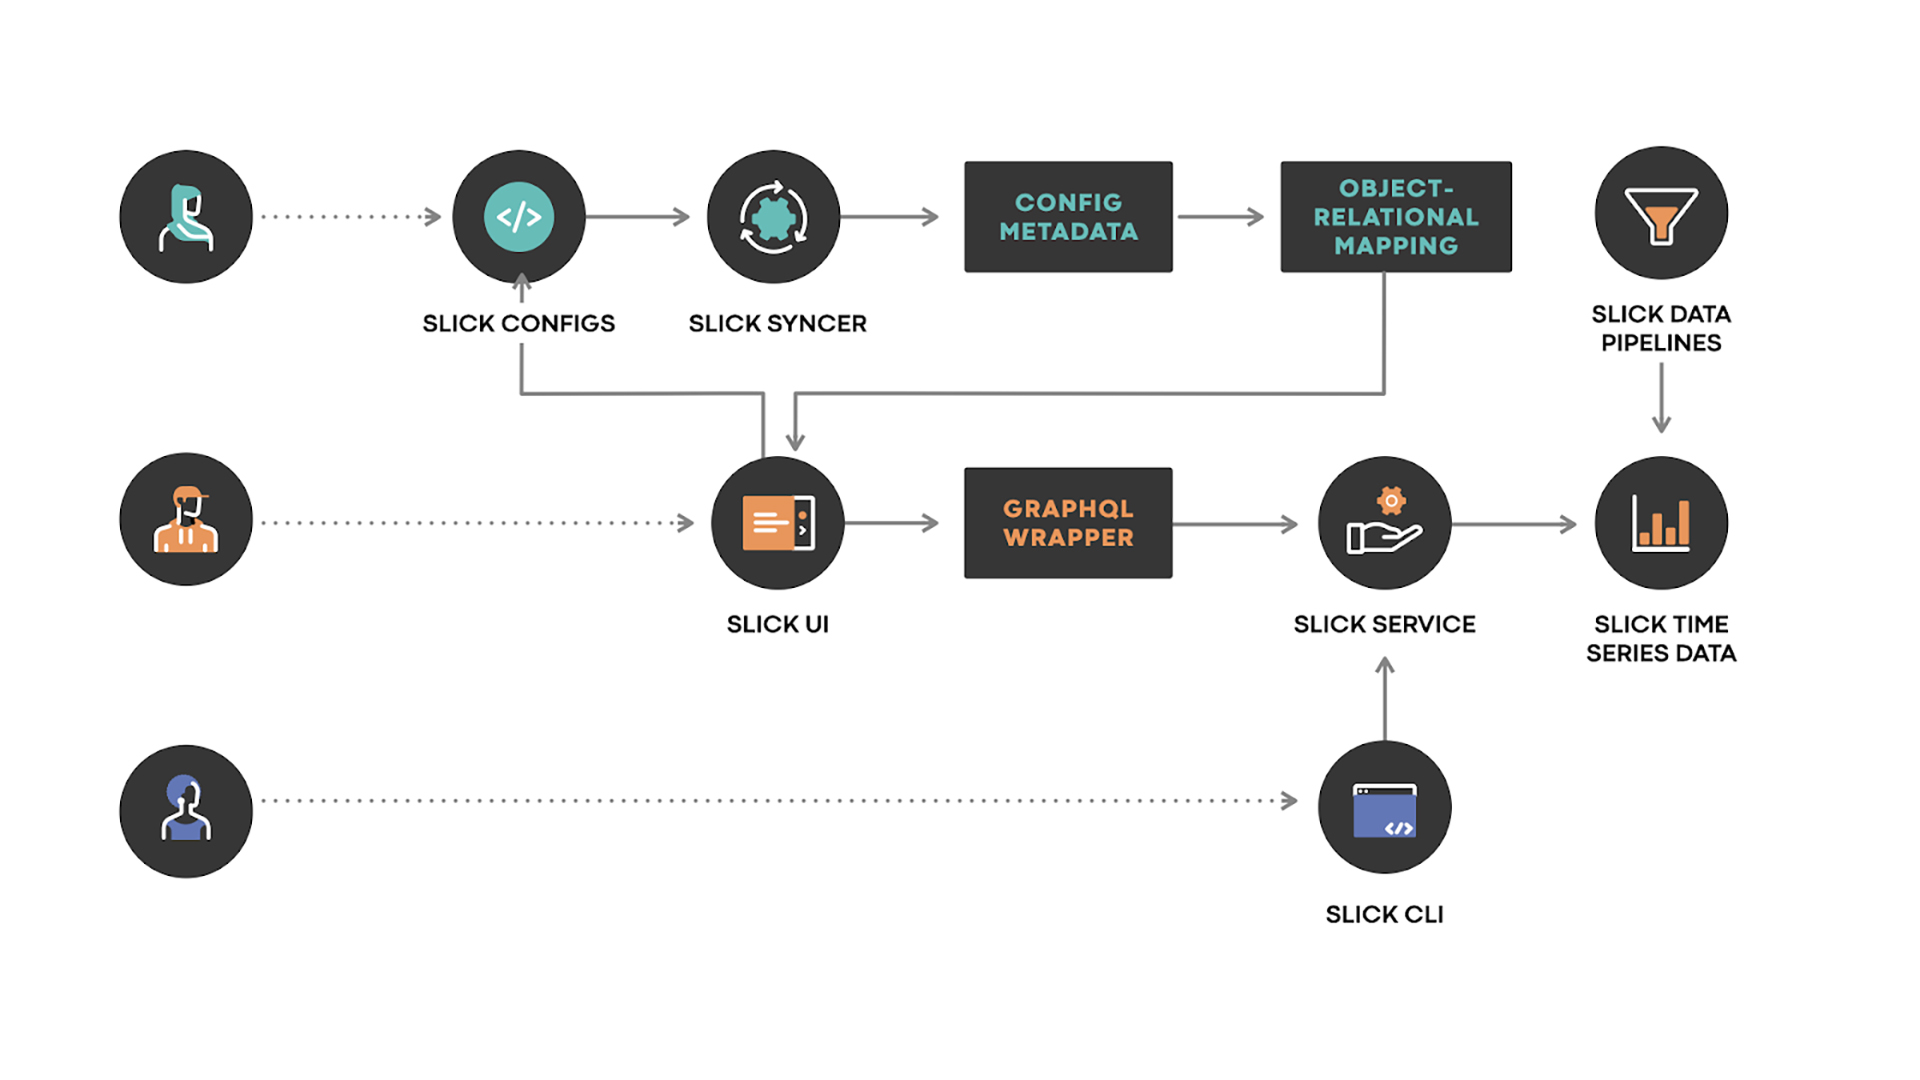
- SLICK Configs: A config file written using SLICK’s DSL, committed by the user to the SLICK config store.
- SLICK Syncer: A service that synchronizes changes made to SLICK configs into SLICK’s config metadata storage.
- SLICK UI: These are the generated SLICK dashboards for every service. The SLICK UI also provides the index mentioned previously.
- SLICK Service: A server that provides an API that is able to answer queries such as “How to compute the SLO for a specific visualization?”. The server allows us to abstract away all the details around data placement and sharding, and it enables the caller to easily find the data needed.
- SLICK Data Pipelines: Pipelines that periodically run in order to capture SLI data over the long term.
Zooming in on the data ingestion
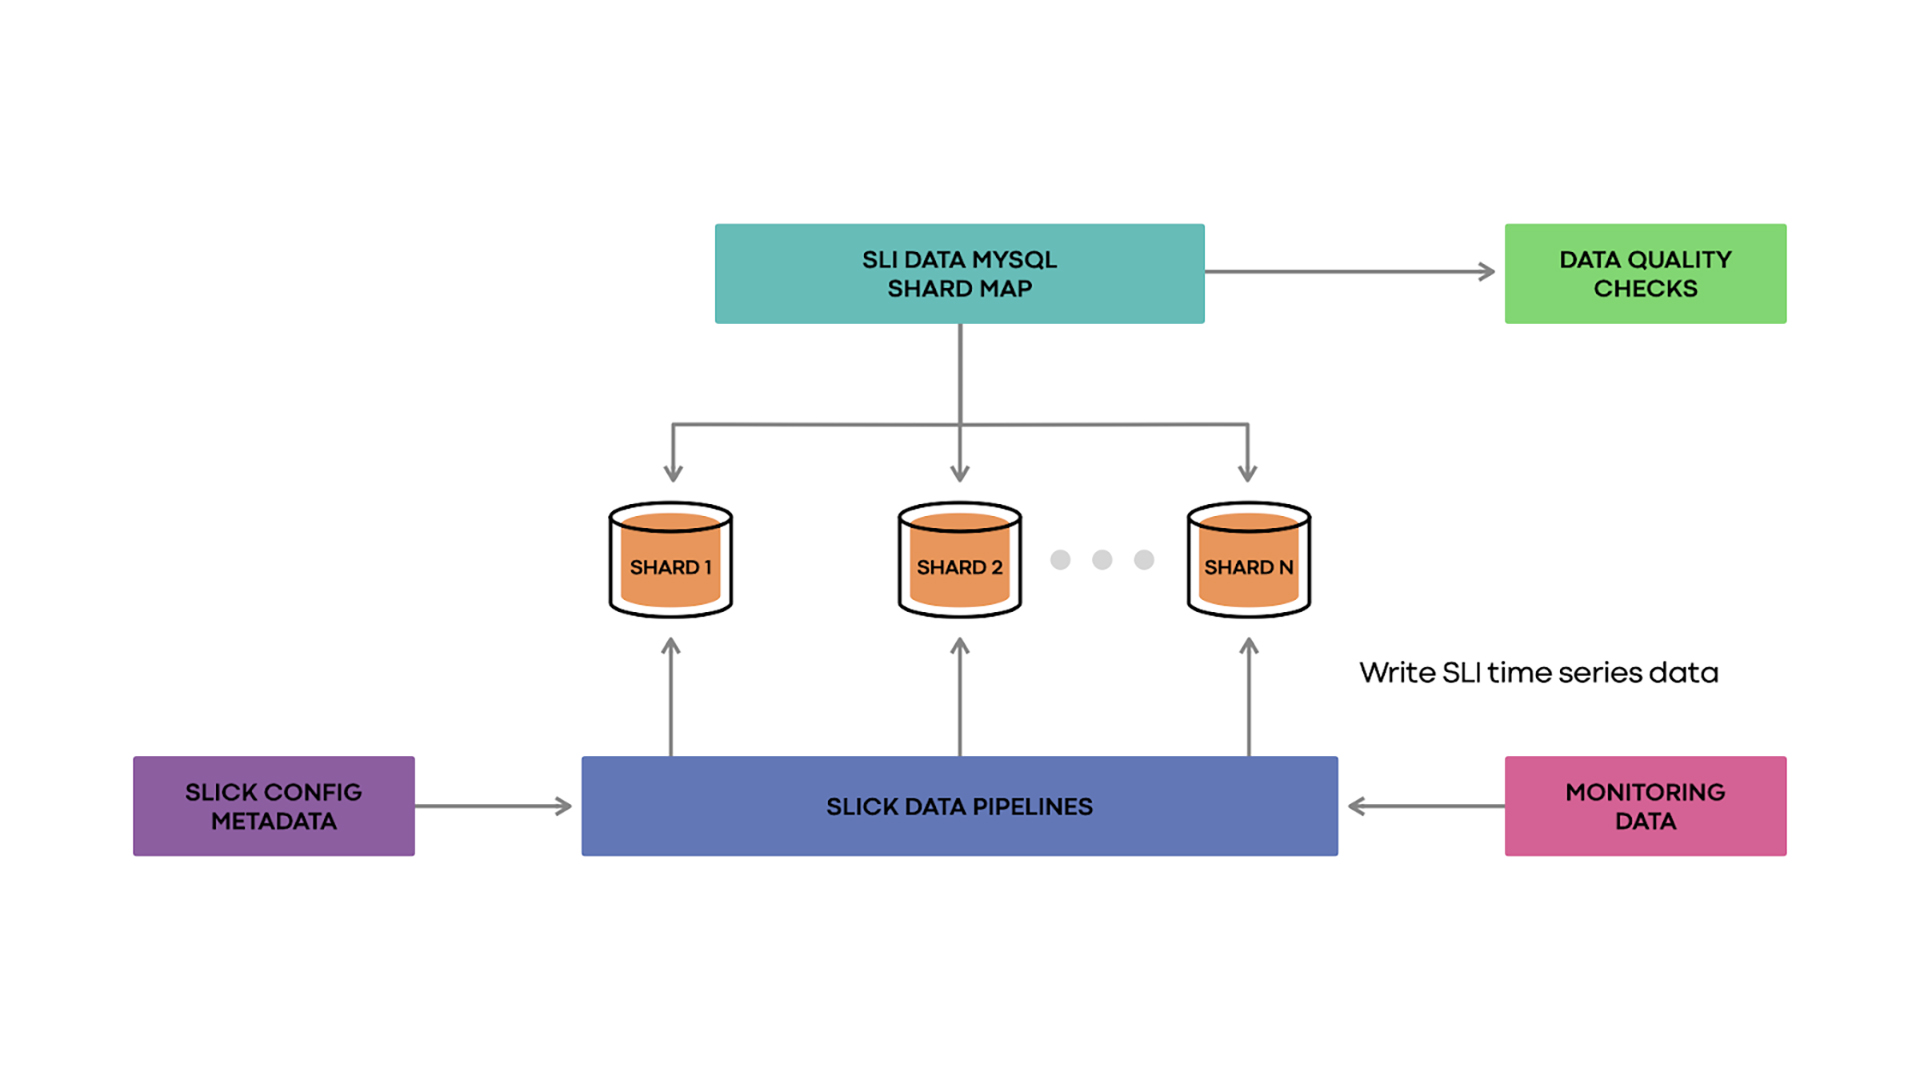
SLICK has data pipelines, which run every hour. These pipelines find the queries for all SLIs by consulting SLICK’s config metadata storage. The pipelines execute all the needed queries against our monitoring data sets to get the raw time series data for each of those SLIs for the hour, with a one-minute granularity.
The pipelines then consult the SLICK shard map to identify where every SLI’s data should be placed, and proceed by bulk inserting the data to the appropriate shard.
In addition, we have data quality checks to give us confidence in the way our data pipelines operate and to quickly catch correctness bugs. The data quality checks run against a set of deterministic testing time series. We treat these deterministic time series just like real SLIs, i.e., we run the pipelines against them, and they get inserted into the sharded DB. We then compare the rows in the DB with the expected time series to verify the system’s behavior.
Current state of SLOs at Meta with SLICK
After building SLICK in 2019, we saw adoption company-wide by 2021, with more than 1,000 services onboarded to SLICK. We’ve also observed many reliability success stories around the company and have shared a couple of these below. Please note that the charts below use mocked data in order to preserve confidentiality, i.e., we’ve removed the dates and slightly altered the values, but the overall shape of the charts remains unchanged.
LogDevice: Detecting and fixing regressions (example)
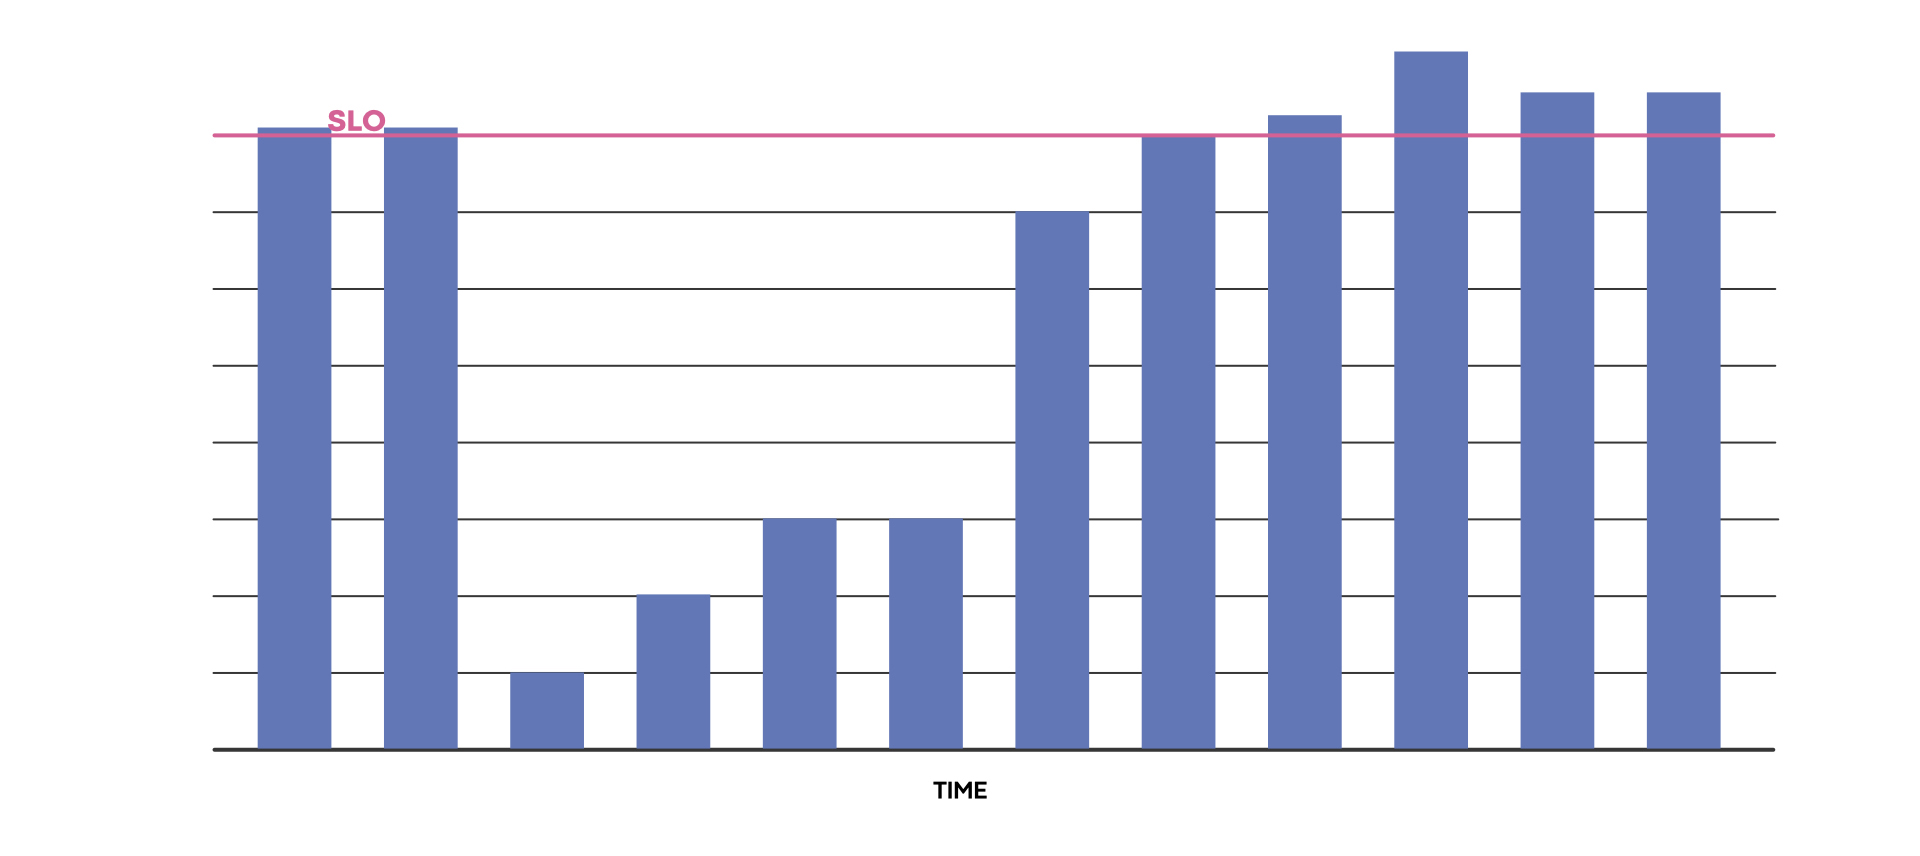
LogDevice is our distributed log storage system. Using SLICK, the service owners could identify a regression in read availability. The team then fixed the issues causing the regression and confirmed via SLICK that the fixes restored the service levels for read availability.
Back-end ML service reliability example
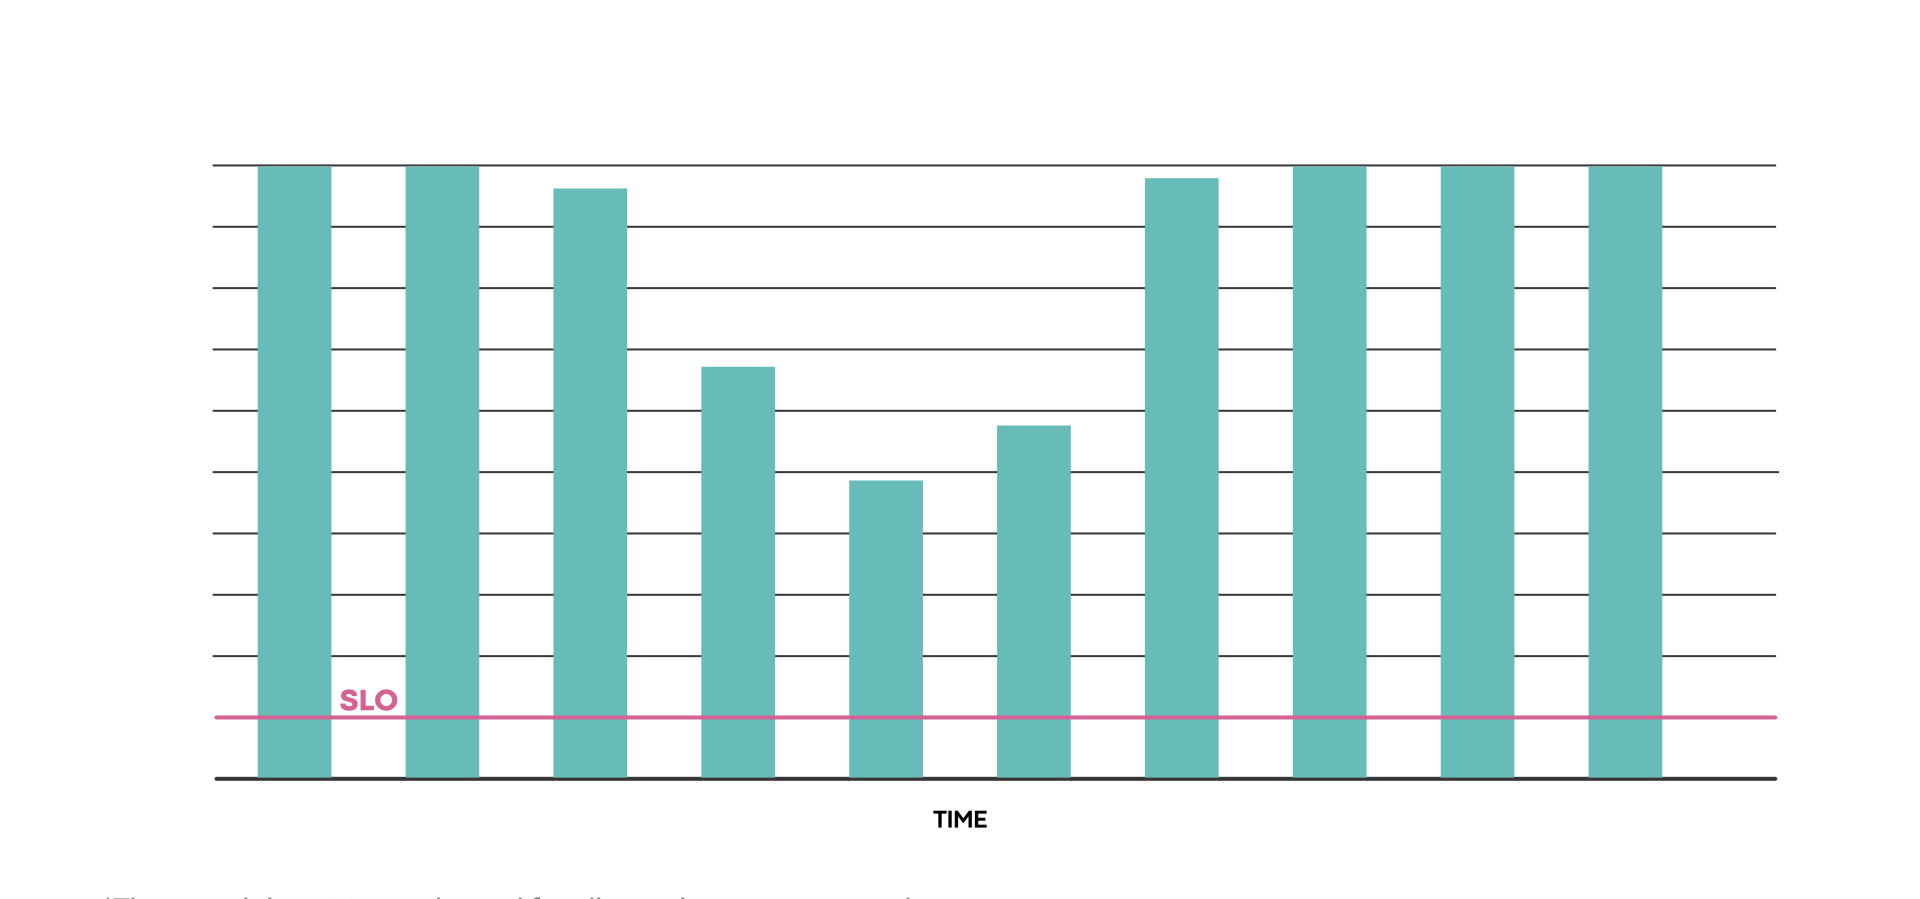
One of the critical back-end ML systems at Meta started experiencing a significant reliability regression in 2020. This involved one of the ML services that affects our end users across our apps.
The SLICK data showed that they were consistently not meeting their SLO, enabling the service team to identify this regression. This data helped kick-start a reliability review, which in turn helped them investigate, find, and fix the root cause of the reliability issues. The team addressed the root cause, and the service went back to meeting its SLO again.
Takeaways from our journey
We have come a long way in our journey with SLOs, and we’ve learned a few lessons along the way:
- Long-term tracking capability is extremely valuable, as it helps us understand trends. We can then plan for reliability work over a longer period.
- SLOs must live at the center of the engineering culture, both in strategic reliability planning and day-to-day conversations.
- Introducing SLOs helped strengthen the overall reliability of our services.
The SLICK team will continue to work on evolving the platform to provide more value. In particular, we hope to invest in the following areas:
- Aligning services’ SLOs with their dependencies’ SLOs. This will allow teams to understand how their dependencies affect their performance. It will also help us surface mismatched expectations between services across the stack that could trigger cascading failures.
- Provide service owners with feedback and suggestions on how to improve their services’ reliability. We would like to use our past experience with improving reliability to provide actionable insights to service owners in order to help them boost their reliability and meet their SLOs.
- Significantly scaling up SLICK. We hope to onboard more teams and services onto SLICK. In order to do this, SLICK needs to stay reliable and scalable (we’ll need to meet our own SLOs!).