
Accelerators are special-purpose hardware devices optimized for specific applications, like AI prediction and video encoding. And Application-specific hardware platforms play an important role in meeting the growing latency and compute demands of workloads like deep learning, content understanding, and video encoding.
At Facebook, the inevitable rise in use of accelerators in our data centers has led to better performance and energy efficiency. However, it is challenging to operate these heterogeneous platforms efficiently at scale. To ensure that these complex accelerators operate smoothly, we need an excellent observability system with monitoring and tracing capabilities so we can understand the performance and interactions between CPUs and accelerators.
To meet these challenges, we’ve introduced three new tools:
- ASIC Monitoring (Asicmon), a scalable observability framework. Asicmon’s library abstracts an accelerator’s custom interfaces and provides a standard interface to our internal tools. Asicmon has facilitated load balancing, performance monitoring, and automated health checks for hundreds of thousands of accelerators running in our data centers.
- Asimov, a custom specification language that makes developing and rapid prototyping new accelerators easier. It has shrunk our development time for onboarding a new accelerator from a month to under a week.
- Atrace, an accelerator tracing solution that collects traces remotely on production servers. It allows us to inspect accelerator systems in detail and provides actionable trace summaries and analyses. An initial version of Atrace allowed us to close a 10 percent performance gap between Caffe2 and PyTorch implementations of a large AI model.
Background
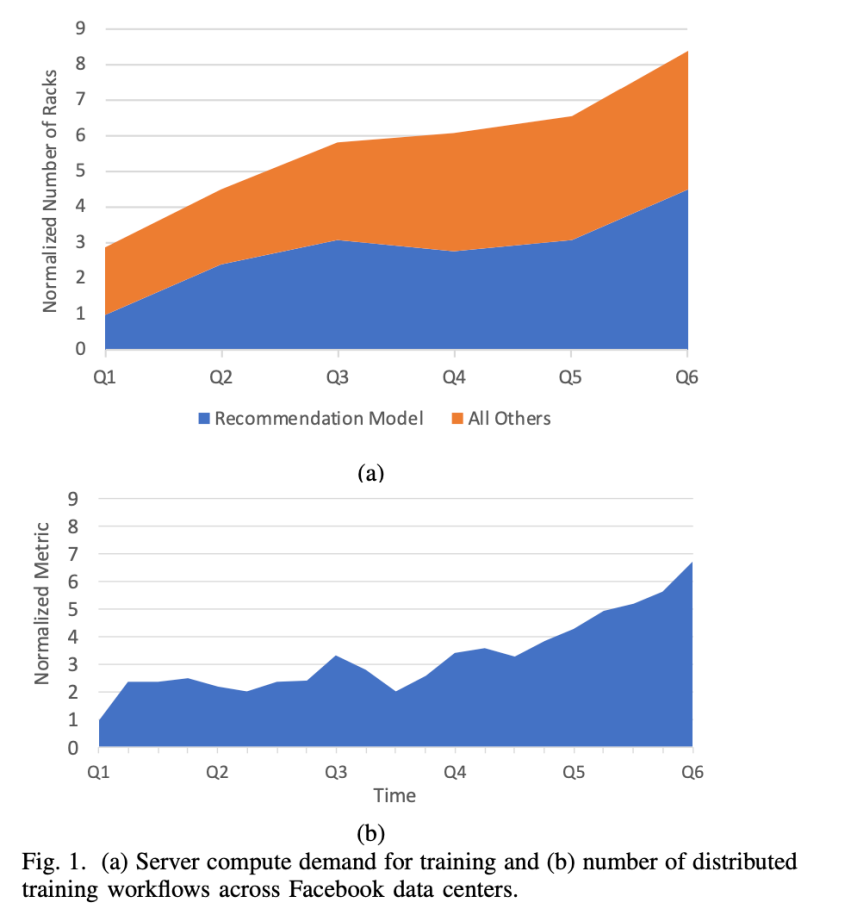
Facebook’s cloud infrastructure handles about 150 trillion AI predictions per day for tasks ranging from feed recommendations to combating harmful content. Running these AI models comes with heavy infrastructure demands. And as these models improve, so do their computational requirements.
The graph below of AI model adoption at Facebook illustrates this unmistakable pattern.
The need for accelerators
Good old general-purpose processors (CPUs) offer versatility and have grown exponentially faster over the decades. However, CPUs fail to meet the rising computational demands of AI applications today. They also tend to exhibit inefficiency in terms of energy used per AI prediction. As investigated by the OpenAI community, we’ve seen two distinct eras of compute in AI models. In recent times, model complexity and compute requirements for AI have grown by roughly a factor of 10 each year. This far outpaces improvements in CPU performance.
How do we remedy this? By designing hardware that is customized to accelerate AI operations via application-specific integrated circuits (ASICs).
Since 2019, Facebook has invested heavily in deploying accelerator-based servers to provide higher performance and energy efficiency. Today, our first-generation systems are 10-30x more performant on our largest AI models. They also delivered a 3-10x performance-per-watt improvement over a CPU.
We also invested in specialized hardware for video encoding and decoding. This enables Facebook to process the nearly 250 million videos uploaded to our app each day. These videos are viewable on any device and with varying internet bandwidth. Our first-generation video accelerators delivered a 10x performance-per-watt improvement in processing 4K videos.
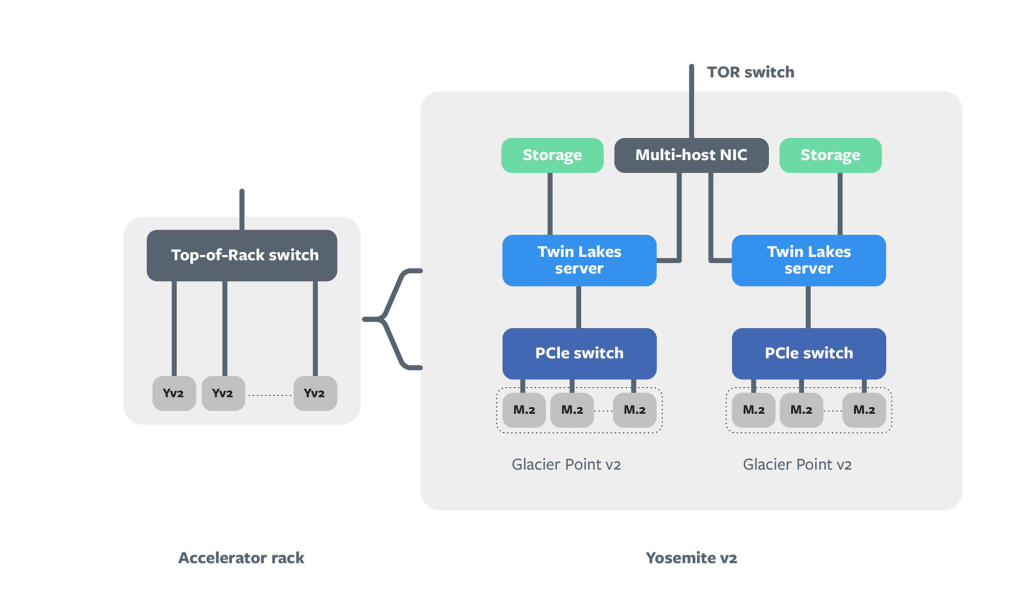
The figure below illustrates the design of our AI inference server. As you can see, it consists of two Twin Lake CPUs and multiple accelerators (M.2 modules) connected to them using a PCIE switch.
The challenges of operating accelerators
In your typical cloud server, the CPU represents the most complex component. We focus a lot on building software to efficiently operate the CPU and monitor its performance and availability. However, with an accelerator system, we can imagine the CPU now has a complicated and brawnier sibling! The accelerator, or ASIC, represents a complex hardware and software system in its own right.
To deliver an excellent user experience, the cloud infrastructure needs to keep hundreds of thousands of accelerators running reliably and efficiently. This is where observability systems come to our rescue. Observability allows us to understand what happens in the accelerator hardware and software when any issue arises. It is useful in multiple ways:
- Health monitoring: Just like any other piece of hardware, accelerators can overheat or hit a faulty condition or a functional bug. We can track various health metrics for the ASICs and use them in automated systems. These systems can then (if needed) remediate the issue by rebooting the accelerator or moving it into a repair state.
- Performance monitoring: By monitoring the performance and system load on an accelerator, we can efficiently scale our AI jobs to meet variable demand throughout the day. It also enables us to detect regressions in performance with new software deployments.
- Performance profiling: When we encounter issues such as poor performance or time-outs, we need to look deeper into how the accelerator server is functioning. We also need to equip software developers with tools to understand the performance of their applications while they run on accelerators.
The accelerator zoo
Specialization is both a boon and bane for accelerators. As a result, we end up running multiple types of accelerators in our data centers at any given point.
In 2020 we started deploying the first generation of these accelerators. In the near future, we will be developing two to three new accelerators for the second generation. Each accelerator will have unique driver interfaces, making the task of operating them harder. But duplicating the observability software for each accelerator would not be feasible in the timeline we have set out. The observability framework must be easy to prototype and adapt to multiple types of accelerators in a short time. It also needs to be efficient to avoid interfering with the original application.
How we developed Asicmon and Asimov
Our first challenge involved finding a way to effectively monitor different types of accelerators without duplicating code (and developer time). As you may have guessed, we can leverage abstraction to achieve this.
For example, consider an abstract metric: device_utilization — the measure of how busy an accelerator is — which becomes useful for balancing load across accelerators. To compute this metric, we may need to understand the internal architecture of the accelerator. With an abstract counter, however, engineers working on load balancing can more easily use the metric without being aware of finer details.
device_utilization = max(compute_core_active_i) / total_time
With the above in mind, we designed Asicmon with these design objectives:
- Abstraction: We needed a simple and uniform interface for all of our internal monitoring and operational tools to use. This enables infrastructure engineers and hardware teams to effectively operate multiple accelerators in a common way.
- Development velocity: Accelerators are new. Interfaces can also change due to evolving requirements. The framework should be easy to learn and able to iterate quickly.
- Performance: Finally, any observability system should be lightweight in terms of resources. As a result, it diminishes interference with high-throughput video and AI applications.
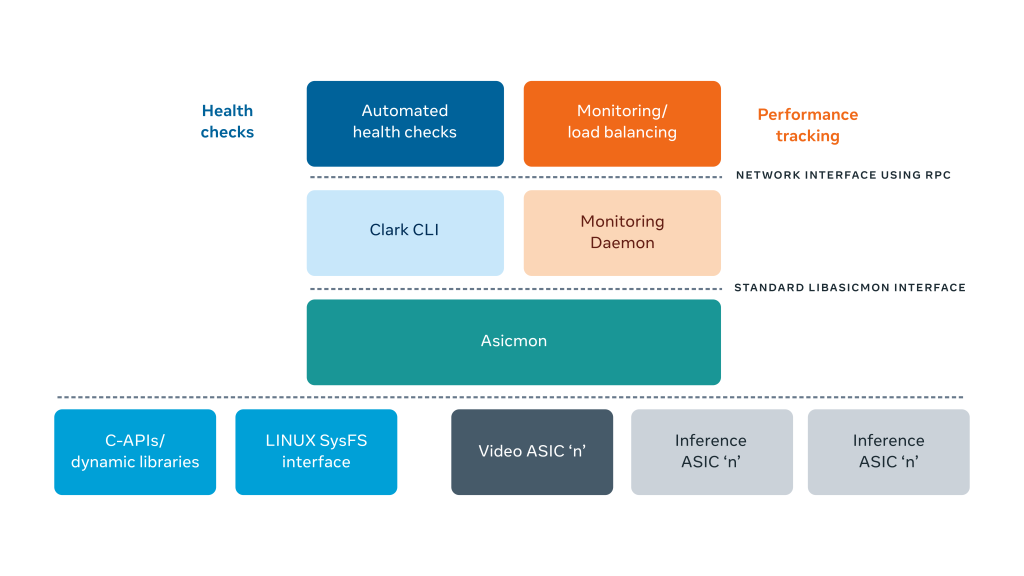
The diagram below illustrates the overall software stack for monitoring accelerators. Asicmon acts as a bridge between individual accelerator drivers and the rest of the internal monitoring software. The left top illustrates automated health check tools that spot bad health signals and automatically fix faulty ASICs. On the right, a telemetry daemon periodically publishes performance metrics for engineers to inspect the accelerators. Furthermore, automated load balancing and auto-scaling systems like Shard Manager utilize these counters.
How does Asicmon work?
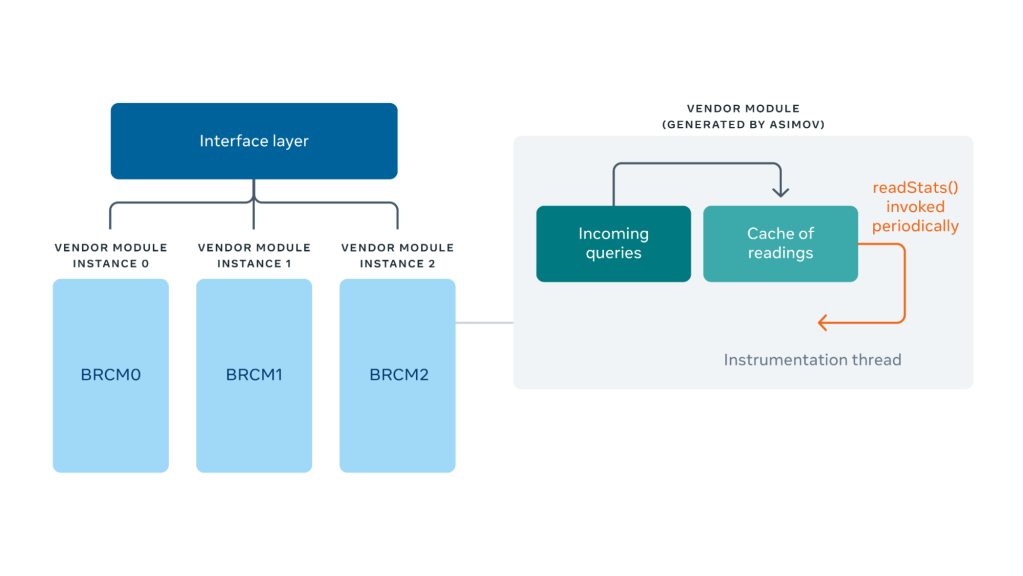
Under the hood, Asicmon creates an instance of a monitoring module per accelerator device. It maintains a cache of statistics that it updates periodically by probing the accelerator driver and computing-derived metrics. Queries to Asicmon’s standard interface for counters get implemented as a lookup into this cache. This shields the system against accidental overload of counter requests.
Enter Asimov
All great so far! We used abstraction to address the scalability aspect of observability software layers above Asicmon. However, the problem of building the glue code between the accelerator driver and these standard metrics still eluded us. This has to be done separately for each of the accelerators that have aggressive and overlapping timelines. So, we needed a method to develop on Asicmon that was quick to iterate and easy to ramp up on, while also being efficient. That’s where Asimov comes in.
Asimov is an expressive Python-like custom language to instrument the accelerator driver. It essentially allows developers to focus on how to probe the accelerator interfaces and express derived metrics using them. The Asimov compiler generates an efficient C++ implementation of the monitoring module. It also handles details like caching the metrics, periodically reading them, and providing thread safety.
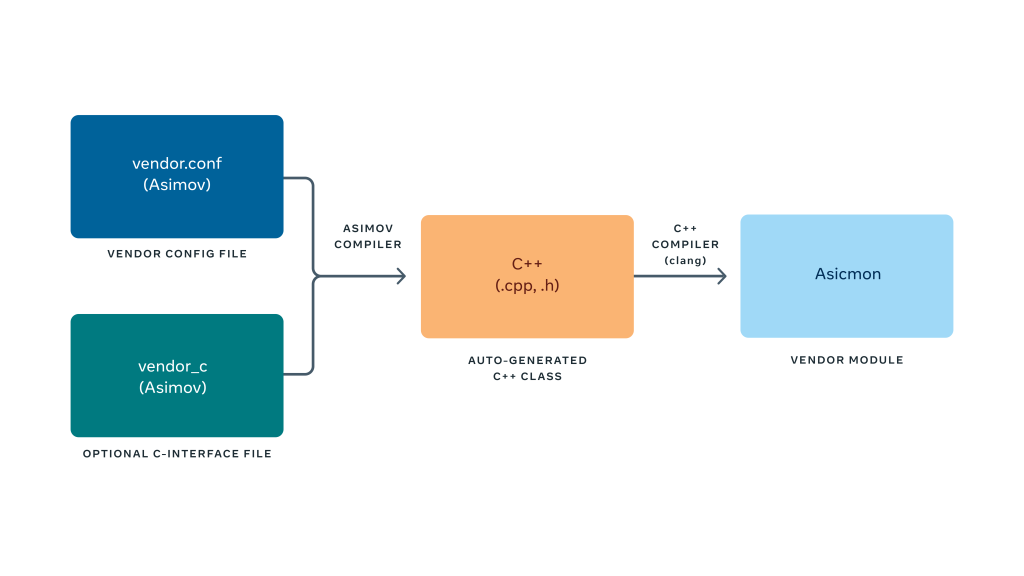
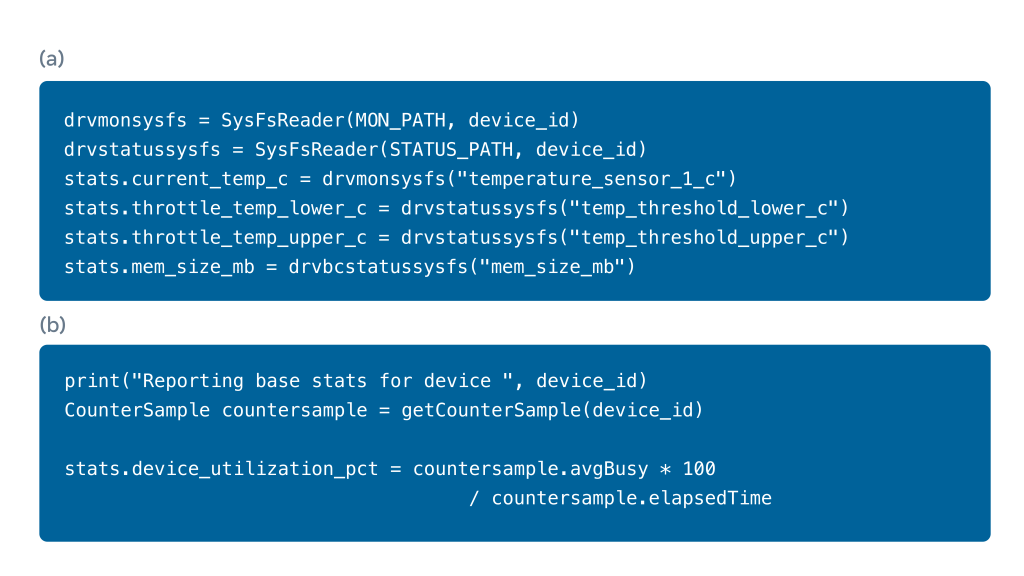
The code snippets below show examples of Asimov being used to read system metrics using interfaces ranging from Linux sysfs files (a) to custom library C functions (b).
Asimov incorporates the same standard interface as Asicmon in its internal representation (the stats data structure, left hand side in the code). We can also invoke C-library functions provided by the device driver and express equations/conditions for derived metrics like any regular language.
Asimov is built with the ANTLR compiler framework under the hood to provide the lexer/parser logic for the language. We then emit C++ code using templates that manage all the essential parts, like initialization, thread safety, etc., so someone using Asimov doesn’t need to worry about it.
Asicmon in action
Let’s look at a few illustrative examples of how Asimov and Asicmon are beneficial for operating accelerators at scale.
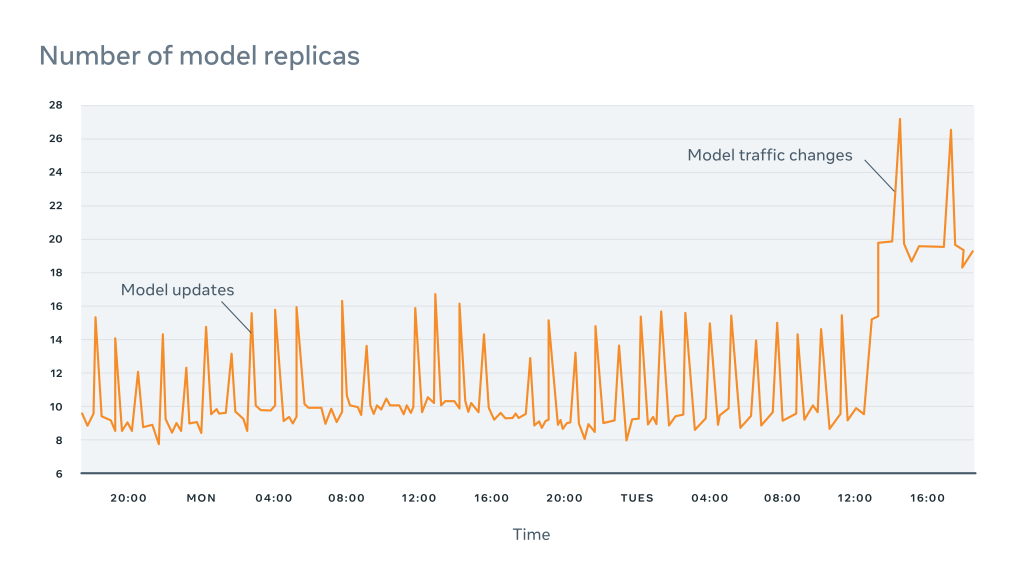
For AI inference applications, we use a system called Shard Manager to automatically scale the inference service instances. A shard is essentially a copy of the AI model that can serve inferences. Asicmon measures the load on the device using an abstract metric — accelerator device utilization. This helps Shard Manager effectively balance the load among servers and automatically scale up or down the number of shards. The diagram below explains how the number of shards gets scaled automatically during model update rollouts and increases in traffic.
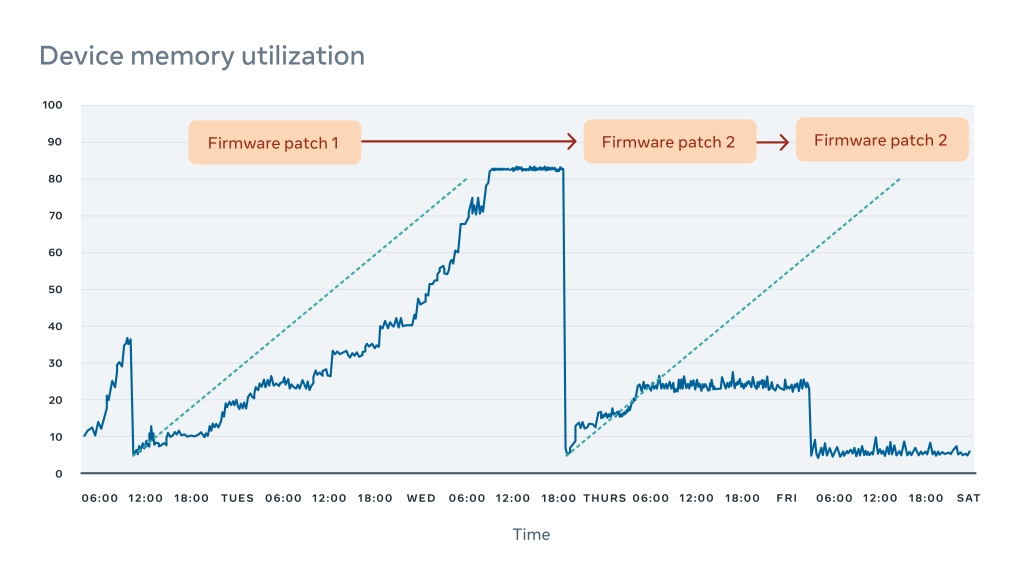
The figure below illustrates the advantages of building observability early on in a project’s development cycle. In our test deployment for video accelerators, we detected a memory leak using an Asicmon counter for available device memory. It took multiple fixes to the driver to finally resolve the issue, well in time before its debut in production.
Finally, let’s take a look at the ease of prototyping with Asimov. While we certainly took longer to build the first version of Asimov alongside the first video accelerator, supporting the second one (the AI inference accelerator) went incredibly fast. Bootstrapping basic metrics for the AI inference accelerator took less than a week. Since implementing Asicmon we’ve been able to increase our AI accelerator metrics support from ~30 percent to ~75 percent
Atrace: Accelerator tracing at scale
Why tracing?
Now that we can monitor the performance of accelerators in our data centers, the next step involves addressing why performance metrics like the latency and throughput change over time. The tried-and-tested method for CPUs involves leveraging a stack-based profiler to sample the running function call stack at periodic intervals. However, for inference accelerators, tracing is the best form of profiling. Why? Because accelerators use special hardware units and thus do not have an equivalent notion of a function stack on a core.
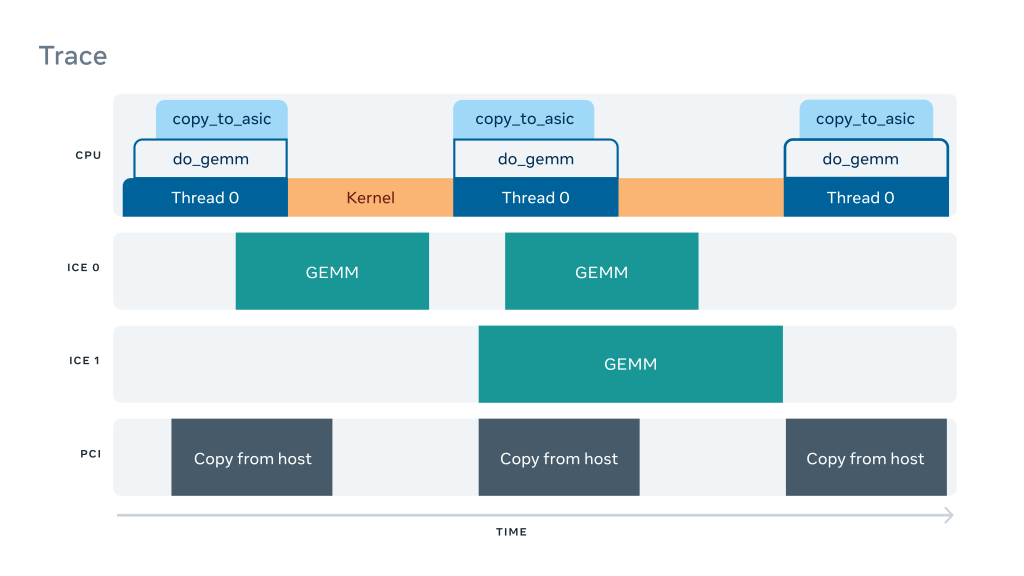
As shown in the figure below, a trace essentially consists of a time series of events occurring on different parts in a system. Events in a trace can represent, among many things, functions, execution of AI operators, or data transfers. Traces offer deeper insights into the operation of the system, including understanding the latency and scheduling of operators and how the CPU and accelerator interact with each other.
Designing the tracing system
While AI inference accelerator vendors do provide tools and APIs to collect traces from the device. These tools are designed to work on a single server and are often hard to use. In order to profile production systems better, we set out building a layer on top of this native capability. This better scales out the collection, processing, and analysis of traces themselves.
We kept two target use cases in mind while developing Atrace:
- Model development: Model developers would typically be attempting to target their AI models to new inference hardware. They can run the tracing tool locally. But by integrating it with internal visualization and summarization tools, we can provide quicker feedback to engineers to iteratively tune their model.
- Production: Debugging performance issues in production is an important use case for tracing. For instance, say a continuous integration (CI) test detects a regression in performance. By collecting traces remotely and on the fly, production engineers can quickly diagnose the problem.
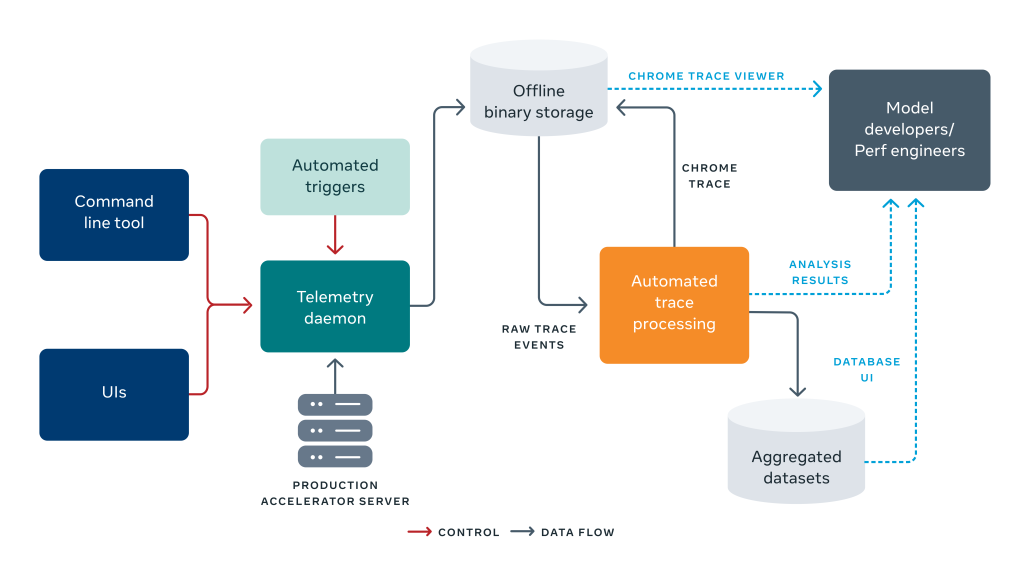
To develop a scalable and ubiquitous tracing solution, we built a set of components that remotely trigger and collect traces. We save each trace to a shared storage and post process and summarize it. The diagram below outlines this, starting on the left with the trace being triggered, to the trace collection and post processing on the right.
Insights from accelerator traces
Trace profiles and summaries
Traces themselves can be enormous and overwhelming to dive into directly. However, we can learn a great deal about an AI program by summarizing the trace at a high level. To achieve this, we built a summary of trace statistics grouped by various AI operator types, as shown below.
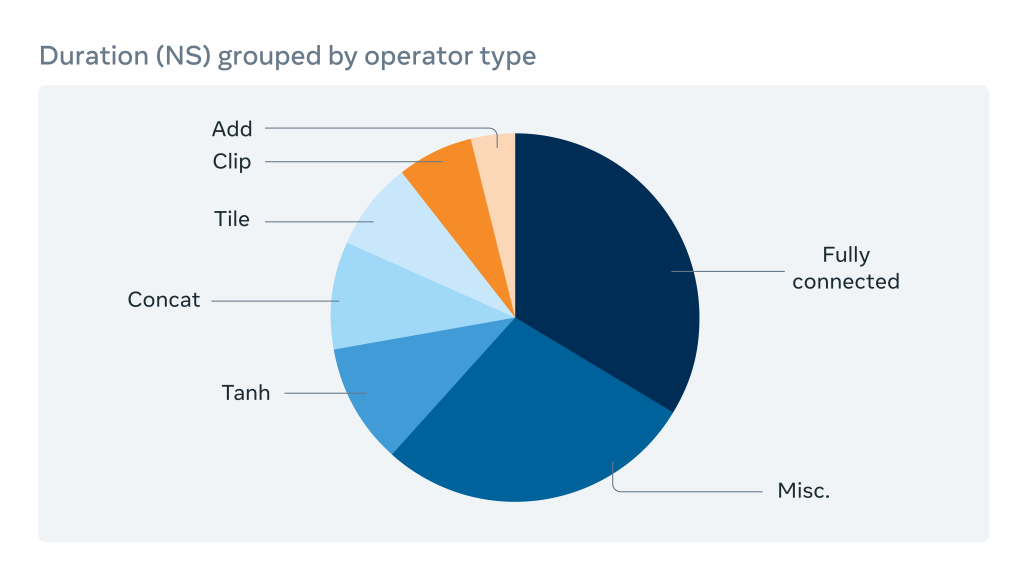
This operator breakdown shows our engineers which operators consume the most execution time and merit optimization. It also allows for comparisons and debugging of performance regressions between two software versions.
Trace critical path analysis
For advanced users, who might want to delve deeper into the traces, we added visualization support for both the open source Chrome trace viewer and an internal trace visualization tool from Facebook. It works all from a single click. We can also run automated analysis on the trace to infer the critical path of operators. This uses the dependency graph of the AI model and trace statistics.
This analysis lets us optimize the latency of the AI prediction. It can also highlight issues like an imbalance in operators. Doing so closed a 10 percent latency gap between the Caffe2 and PyTorch versions of one of our AI models.
Trace correlation
Lastly, it is also noteworthy that several software layers exist to handle the processing of an inference request. These include the application layer, PyTorch framework, and Glow, an open source graph lowering compiler for accelerators.
For more complex models involving video understanding or natural language processing, we learned that the model may be run partially on a CPU and partially on an accelerator. Thus, tracing the operations across multiple layers on the CPU and correlating them with the accelerator becomes a necessity.
We developed a prototype of trace correlation into Glow and PyTorch. This allowed us to connect operations on the CPU in the Glow runtime, to the accelerator. Trace correlation is important for examining the complex software stack used for AI inference.
Next steps
In addition to continuing to support next-generation AI and video accelerators using Asimov and the Asicmon we are also exploring:
- Open source specifications: There are multitudes of companies building accelerator chips today. But the monitoring interfaces for accelerators lack standardization. We are collaborating with the Open Domain-Specific Accelerators (ODSA) project so the industry as whole can benefit from a common specification.
- Trace visualization and analysis: We are investigating ways to automatically generate optimization recommendations from the trace and support better visualizations, such as integrating with TensorBoard.
- Distributed tracing: Since microservices do not run in isolation, we plan on exploring how to correlate distributed traces collected by the Canopy distributed tracing tool with system-level accelerator traces. This would allow us to debug the end-to-end latency of microservices that use AI accelerators.
Thanks
We would like to thank our many collaborators at Facebook, including Jerry Liu, Thiara Ortiz, Jeremy Yang, Ashwin Poojary, Deng Pan, Craig Ross, Ashwin Narasimha, Gisle Dankel, Michael Anderson, Allan Di Wu, Yinghai Lu, Satish Nadathur, Garret Catron, and Jack Montgomery for supporting us in creating this framework.


