Facebook’s services rely on fleets of servers in data centers all over the globe — all running applications and delivering the performance our services need. This is why we need to make sure our server hardware is reliable and that we can manage server hardware failures at our scale with as little disruption to our services as possible.
Hardware components themselves can fail for any number of reasons, including material degradation (e.g., the mechanical components of a spinning hard disk drive), a device being used beyond its endurance level (e.g., NAND flash devices), environmental impacts (e.g., corrosion due to humidity), and manufacturing defects.
In general, we always expect some degree of hardware failure in our data centers, which is why we implement systems such as our cluster management system to minimize service interruptions. In this article we’re introducing four important methodologies that help us maintain a high degree of hardware availability. We have built systems that can detect and remediate issues. We monitor and remediate hardware events without adversely impacting application performance. We adopt proactive approaches for hardware repairs and use prediction methodology for remediations. And we automate root cause analysis for hardware and system failures at scale to get to the bottom of issues quickly.
How we handle hardware remediation
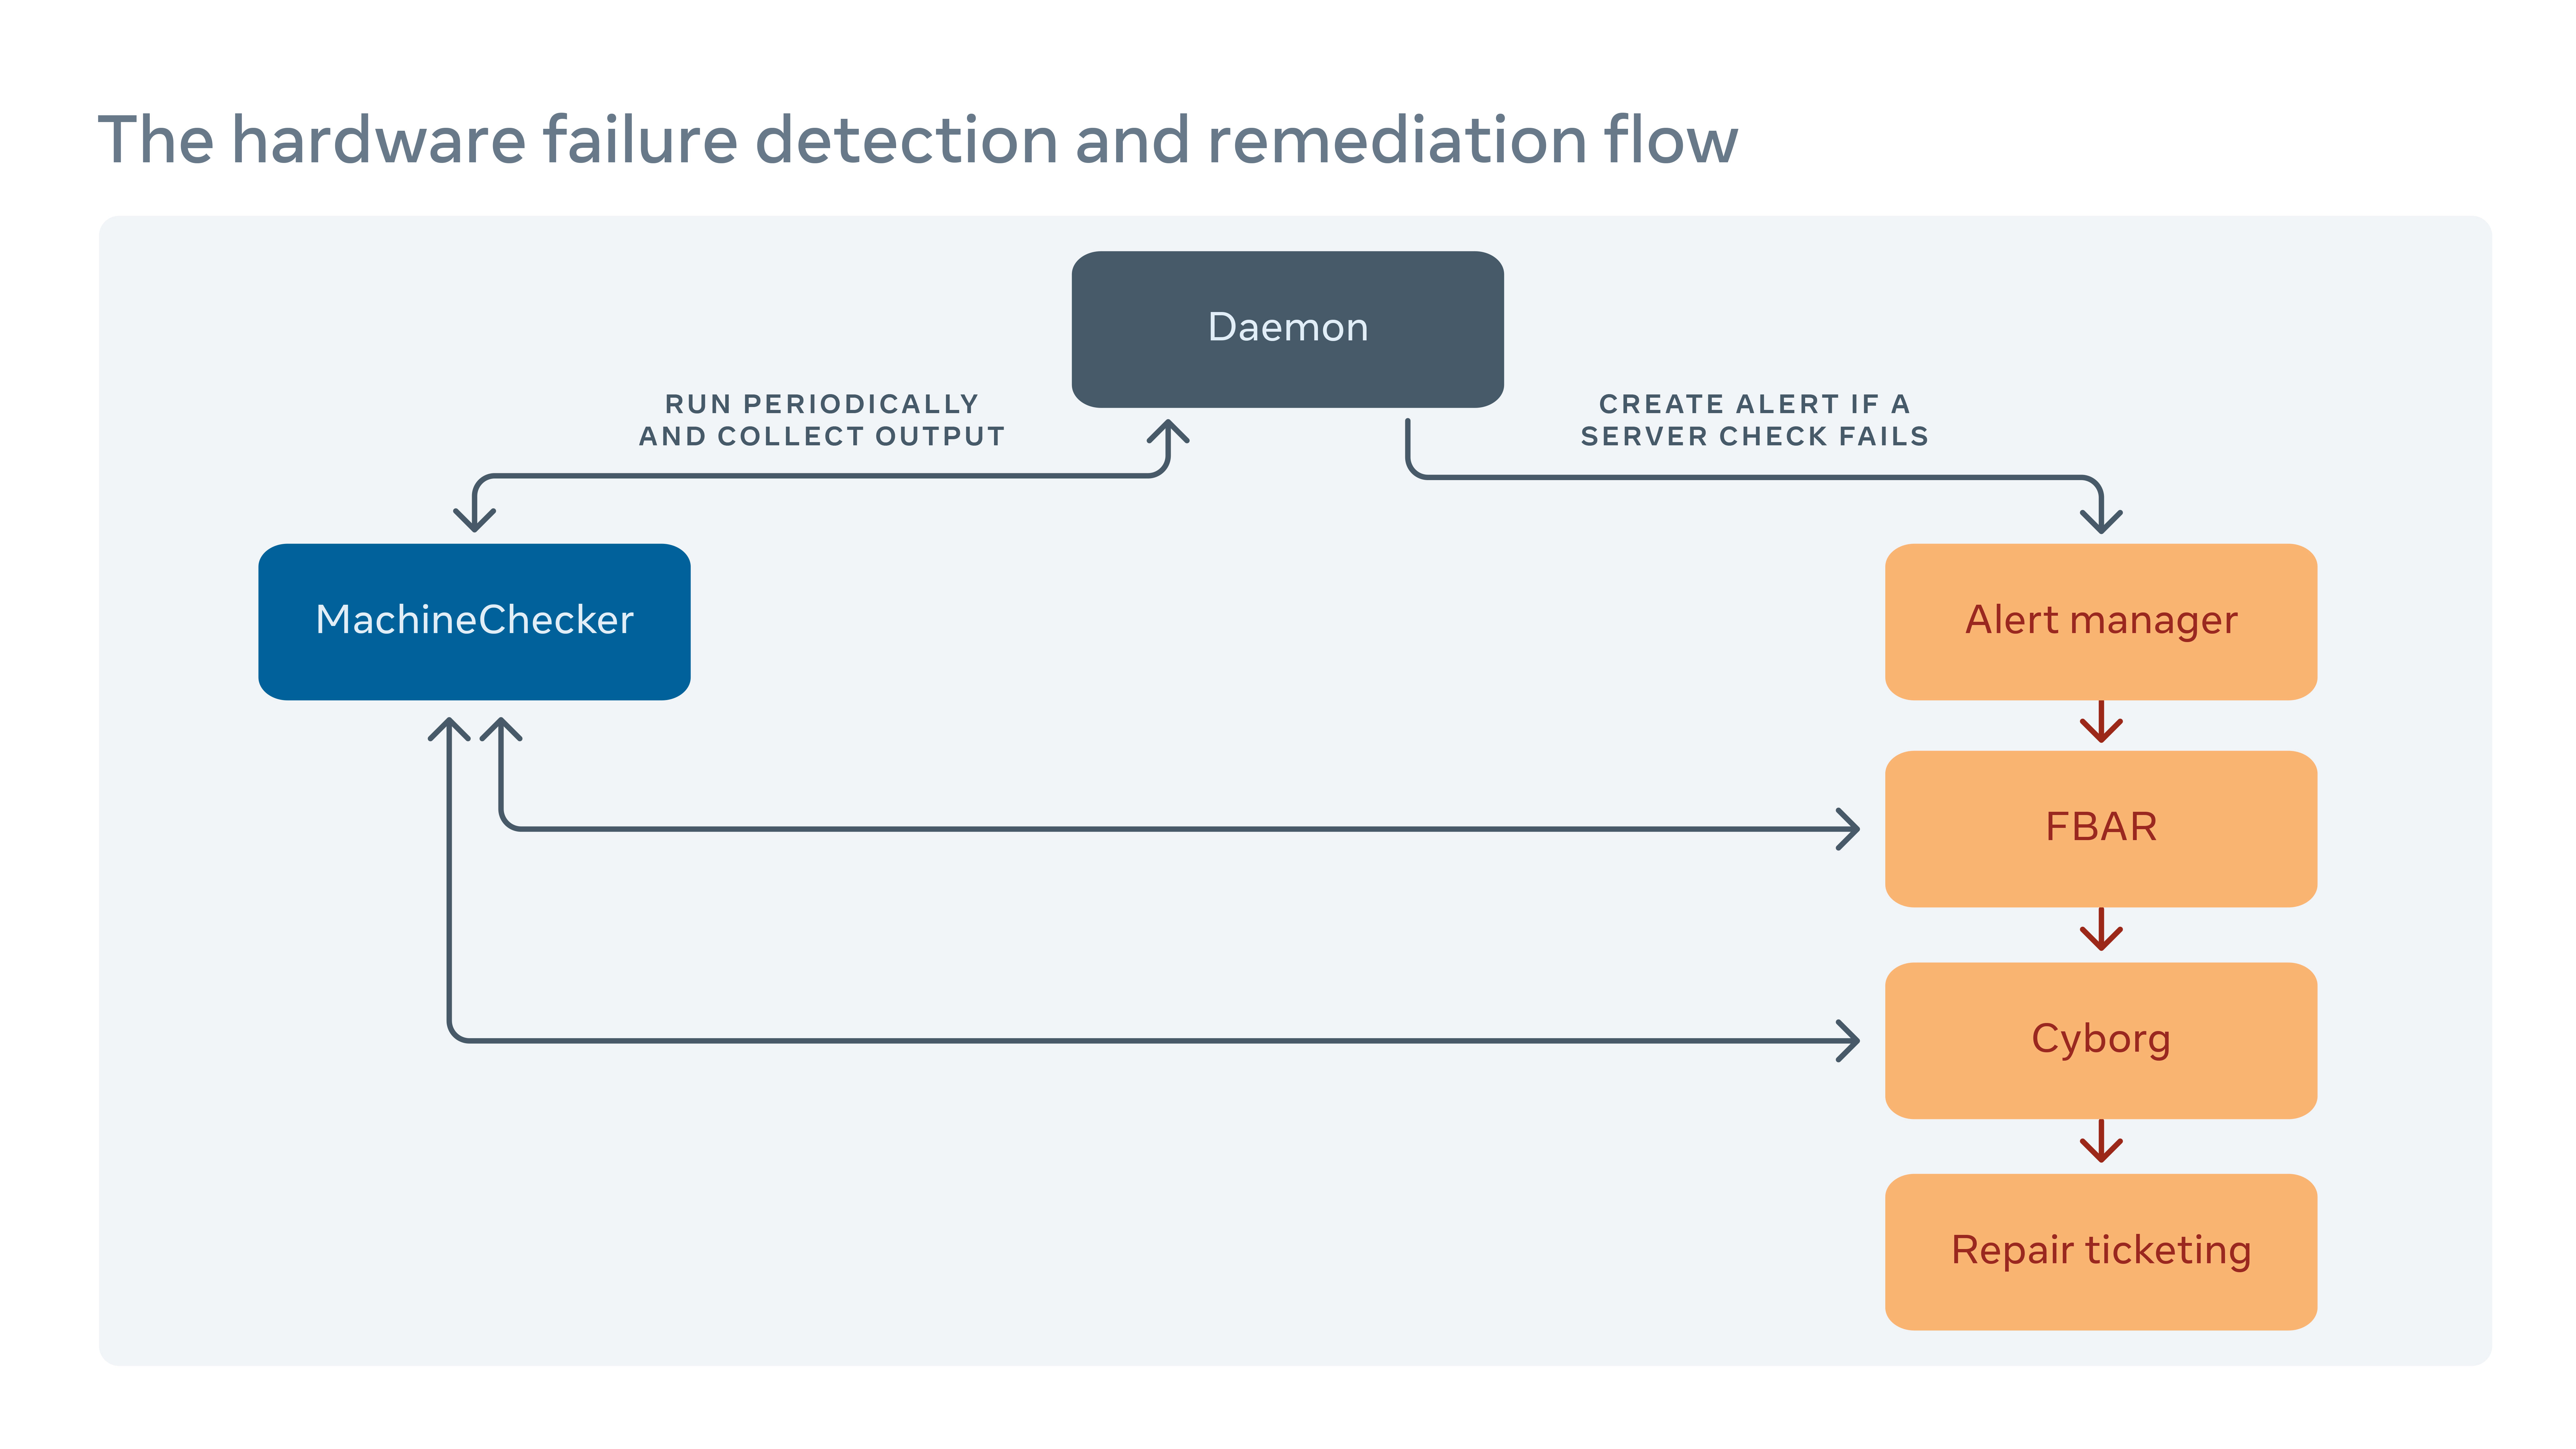
We periodically run a tool called MachineChecker on each server to detect hardware and connectivity failures. Once MachineChecker creates an alert in a centralized alert handling system, a tool called Facebook Auto-Remediation (FBAR) then picks up the alert and executes customizable remediations to fix the error. To ensure that there’s still enough capacity for Facebook’s services, we can also set rate limits to restrict how many servers are being repaired at any one time.
If FBAR can’t bring a server back to a healthy state, the failure is passed to a tool called Cyborg. Cyborg can execute lower-level remediations such as firmware or kernel upgrades, and reimaging. If the issue requires manual repair from a technician, the system creates a ticket in our repair ticketing system.
We delve deeper into this process in our paper “Hardware remediation at scale.”

How we minimize the negative impact of error reporting on server performance
MachineChecker detects hardware failures by checking various server logs for the error reports. Typically, when a hardware error occurs, it will be detected by the system (e.g., failing a parity check), and an interrupt signal will be sent to the CPU for handling and logging the error.
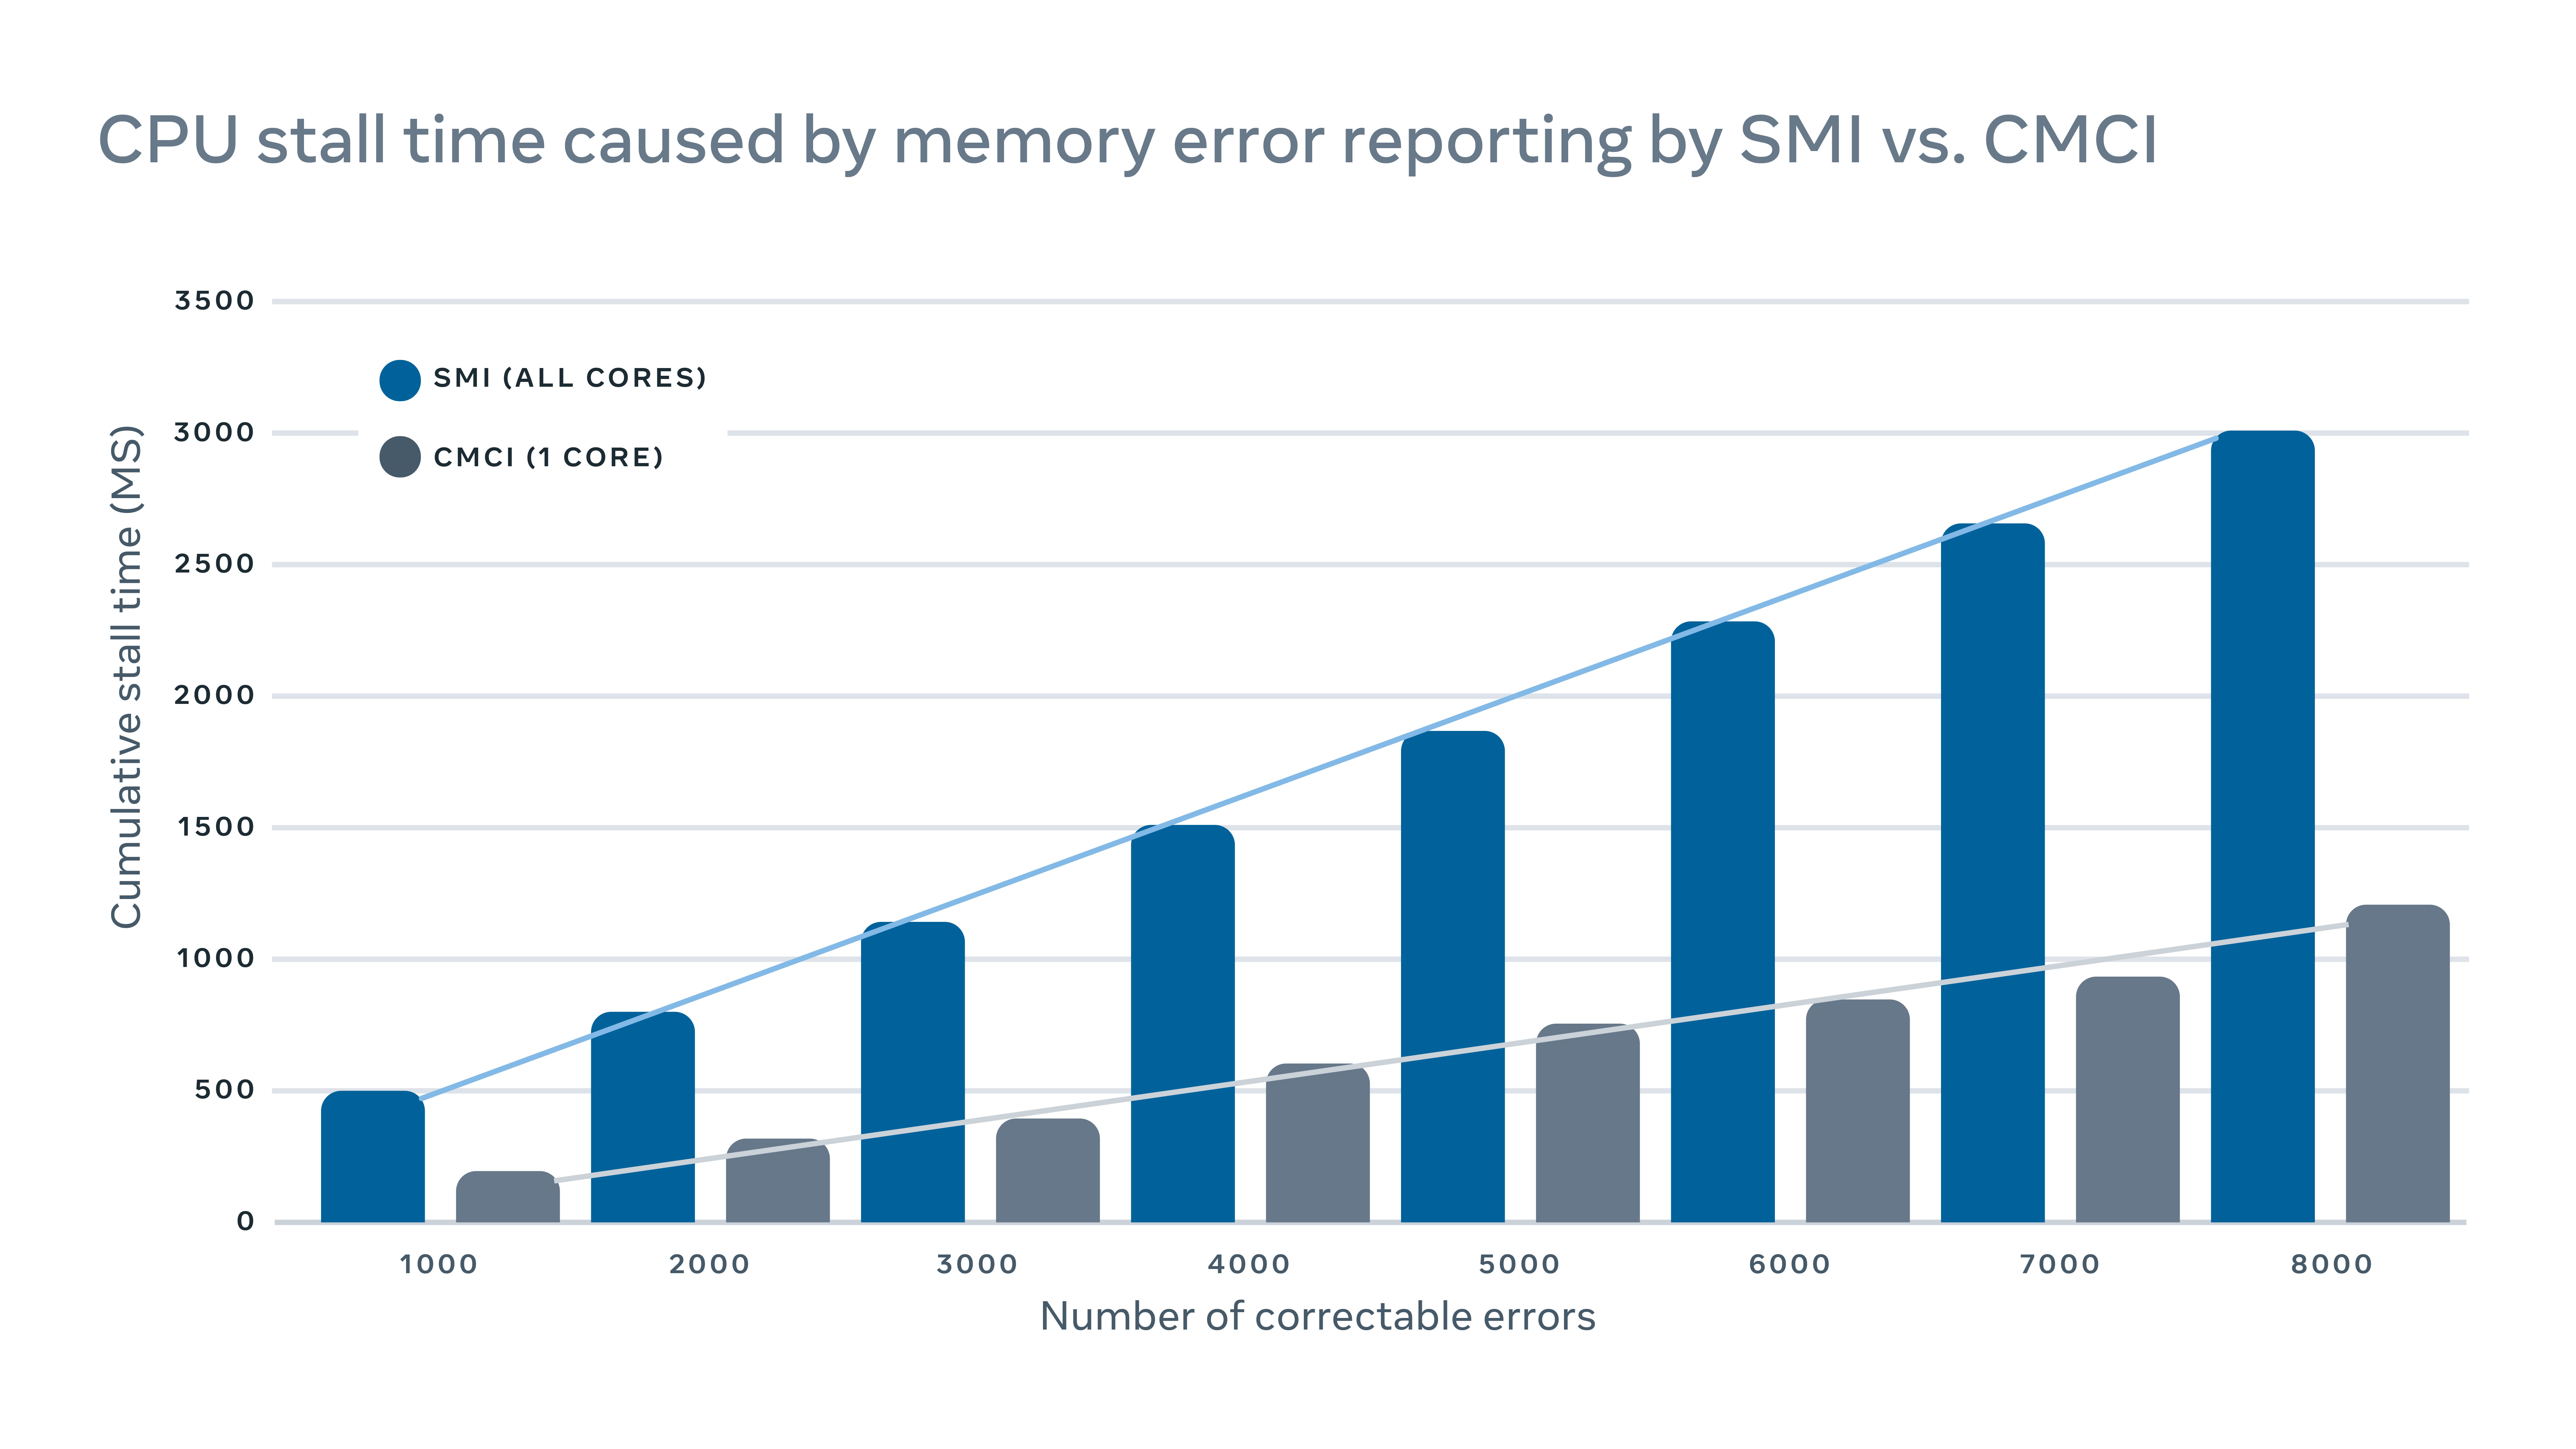
Since these interrupt signals are considered high-priority signals, the CPU will halt its normal operation and devote its attention to handling the error. But this has a negative performance impact on the server. For logging correctable memory errors, for example, a traditional interrupt system management interrupt (SMI) would stall all CPU cores, while the correctable machine check interrupt (CMCI) would stall only one of the CPU cores, leaving the rest of the CPU cores available for normal operation.
Although the CPU stalls typically last only a few hundreds of milliseconds, they can still disrupt services that are sensitive to latency. At scale, this means interrupts on a few machines can have a cascading adverse impact on service-level performance.
To minimize the performance impact caused by error reporting, we implemented a hybrid mechanism for memory error reporting that uses both CMCI and SMI without losing the accuracy in terms of the number of correctable memory errors.
Our paper “Optimizing interrupt handling performance for memory failures in large scale data centers” discusses this in detail.

How we leverage machine learning to predict repairs
Since we frequently introduce new hardware and software configurations into our data centers, we also need to create new rules for our auto-remediation system.
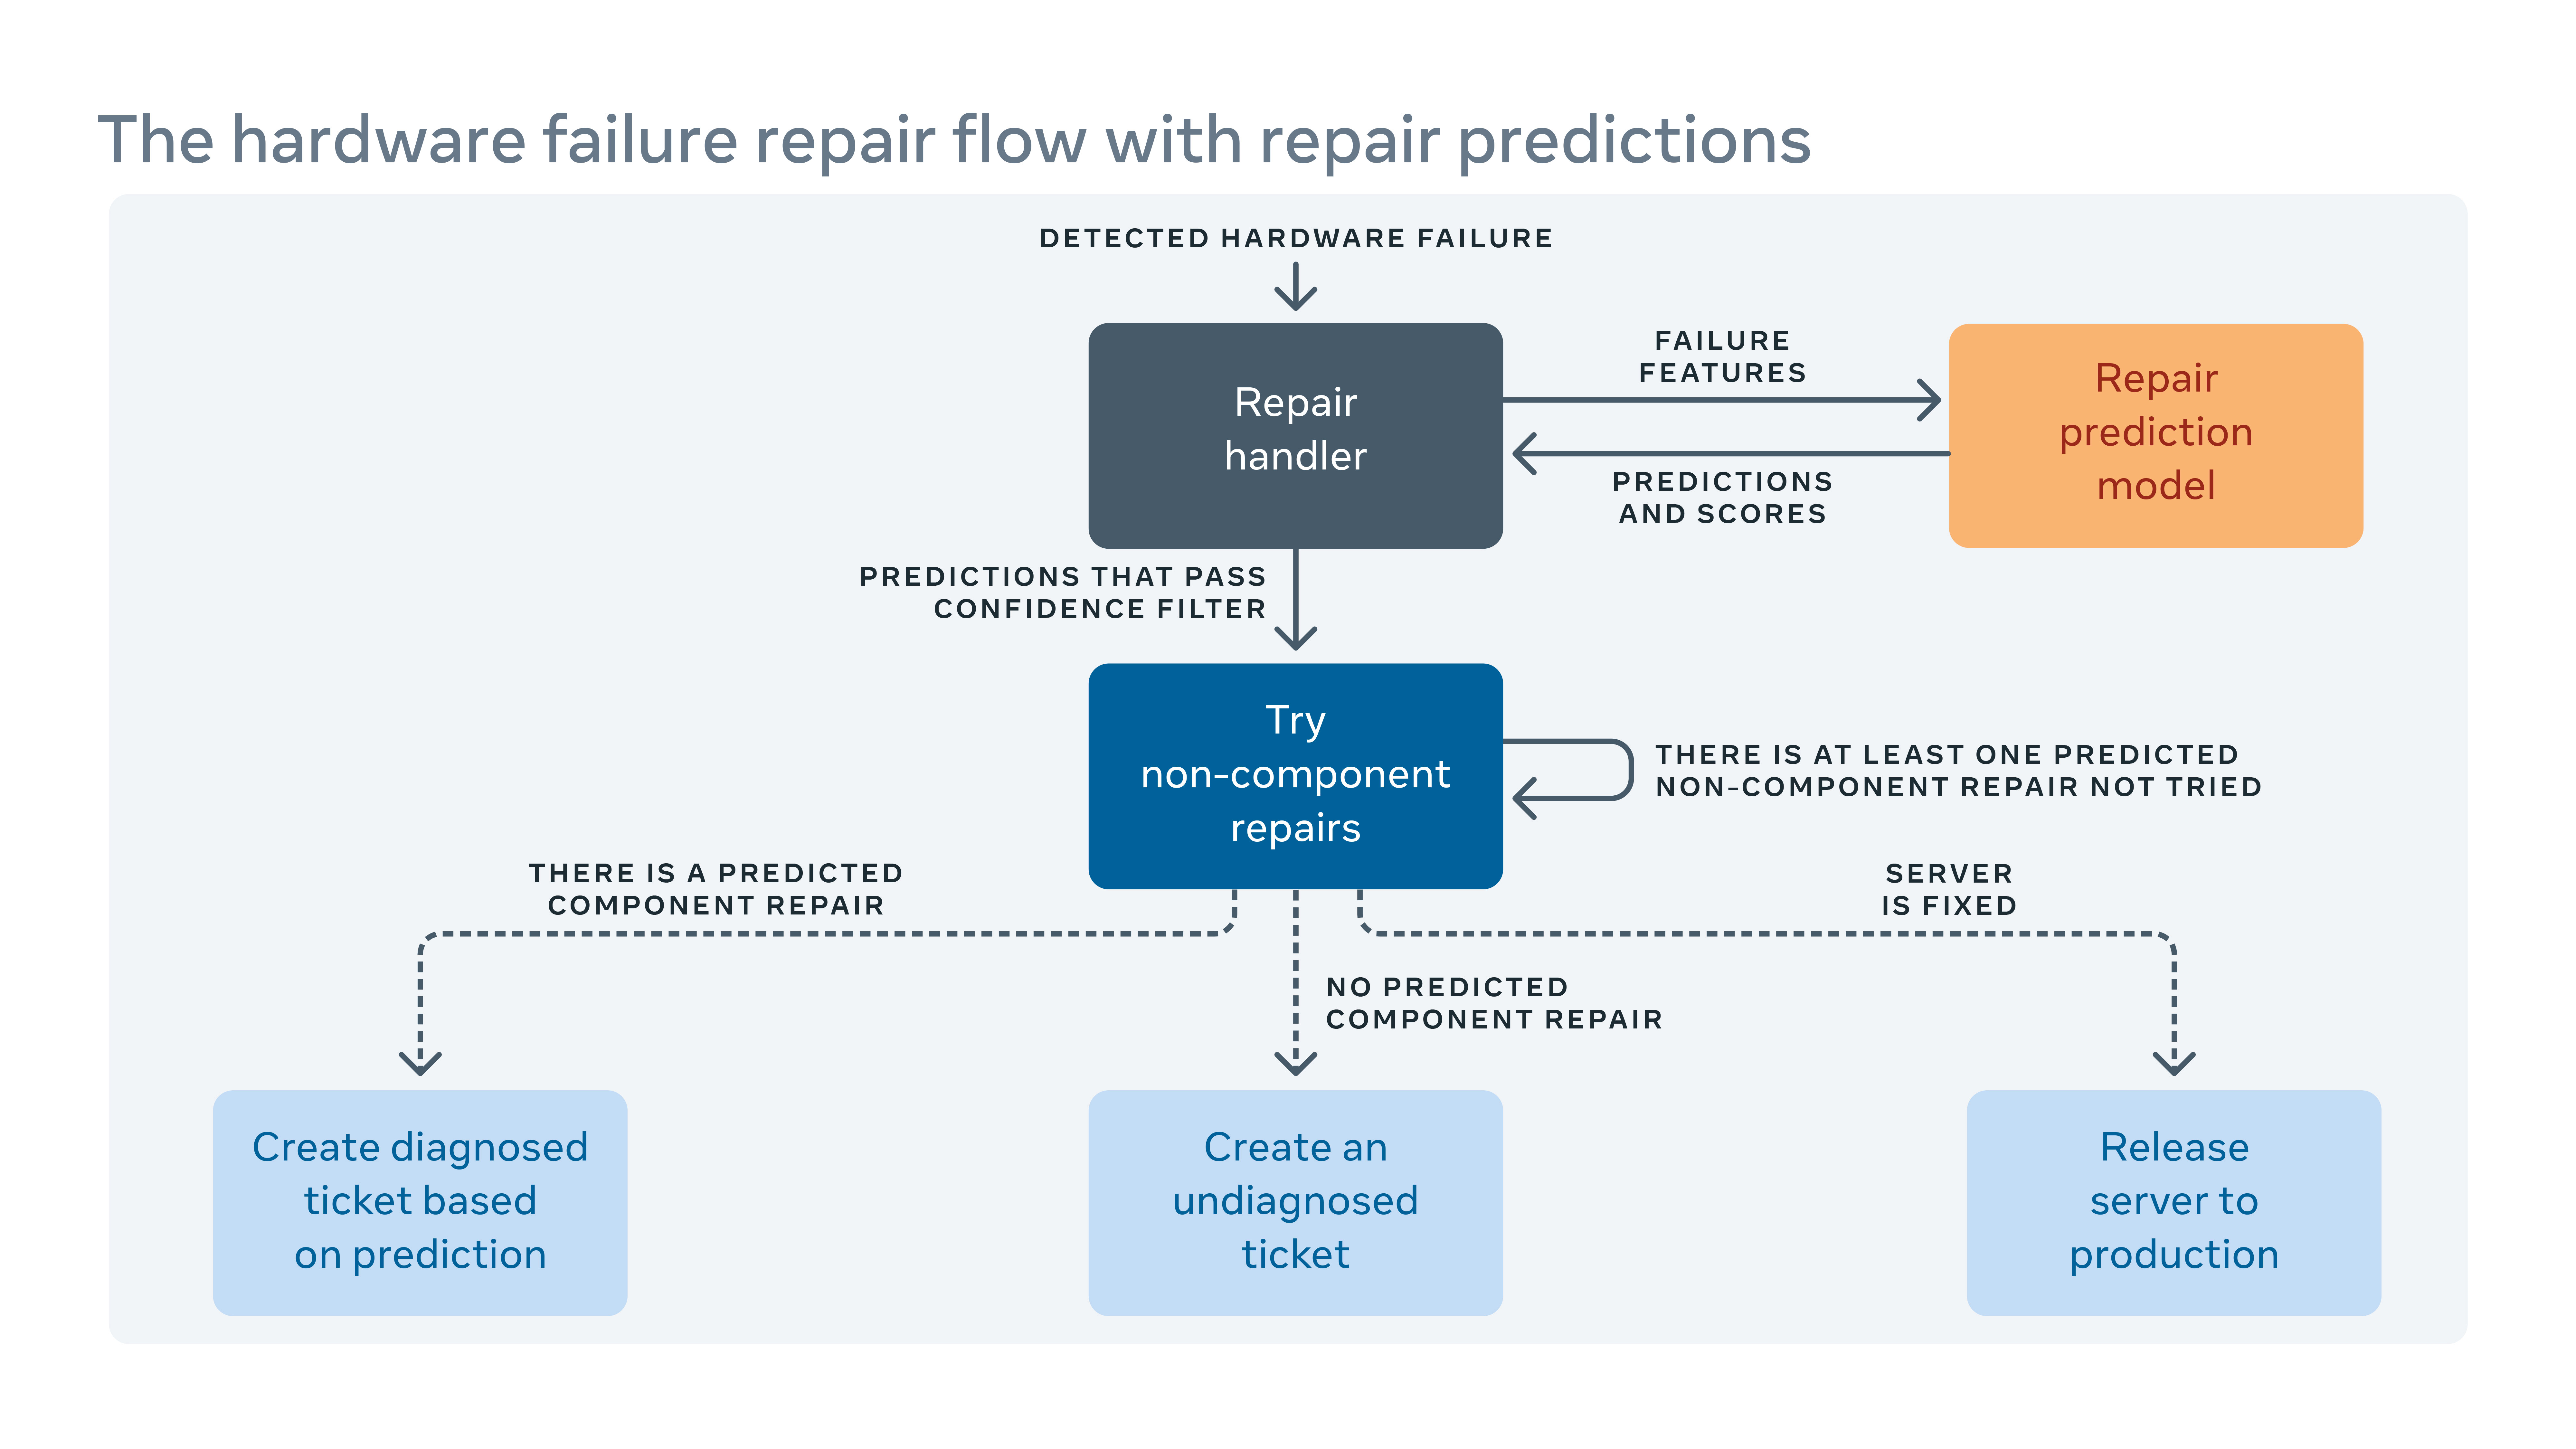
When the automated system cannot fix a hardware failure, the issue is assigned a ticket for manual repair. New hardware and software mean new types of potential failures that must be addressed. But there could be a gap between when new hardware or software is implemented and when we are able to incorporate new remediation rules. During this gap, some repair tickets might be classified as “undiagnosed,” meaning the system hasn’t suggested a repair action, or “misdiagnosed,” meaning the suggested repair action isn’t effective. This means more labor and system down time while technicians have to diagnose the issue themselves.
To close the gap, we built a machine learning framework that learns from how failures have been fixed in the past and tries to predict what repairs would be necessary for current undiagnosed and misdiagnosed repair tickets. Based on the cost and benefit from the incorrect and correct predictions, we assign a threshold on the prediction confidence for each repair action and optimize the order of the repair actions. For example, in some cases we would prefer to try a reboot or firmware upgrade first because these sorts of repairs don’t require any physical hardware repair and take less time to finish, so the algorithm should recommend this sort of action first. Plainly, machine learning allows us not only to predict how to repair an undiagnosed or misdiagnosed issue, but also to prioritize the most important ones.
You can read more about this in our paper “Predicting remediations for hardware failures in large-scale datacenters.”

How we’ve automated fleet-level root cause analysis
In addition to server logs that record reboots, kernel panics out-of-memory, etc., there are also software and tooling logs in our production system. But the scale and complexity of all these means it’s hard to examine all the logs jointly to find correlations among them.
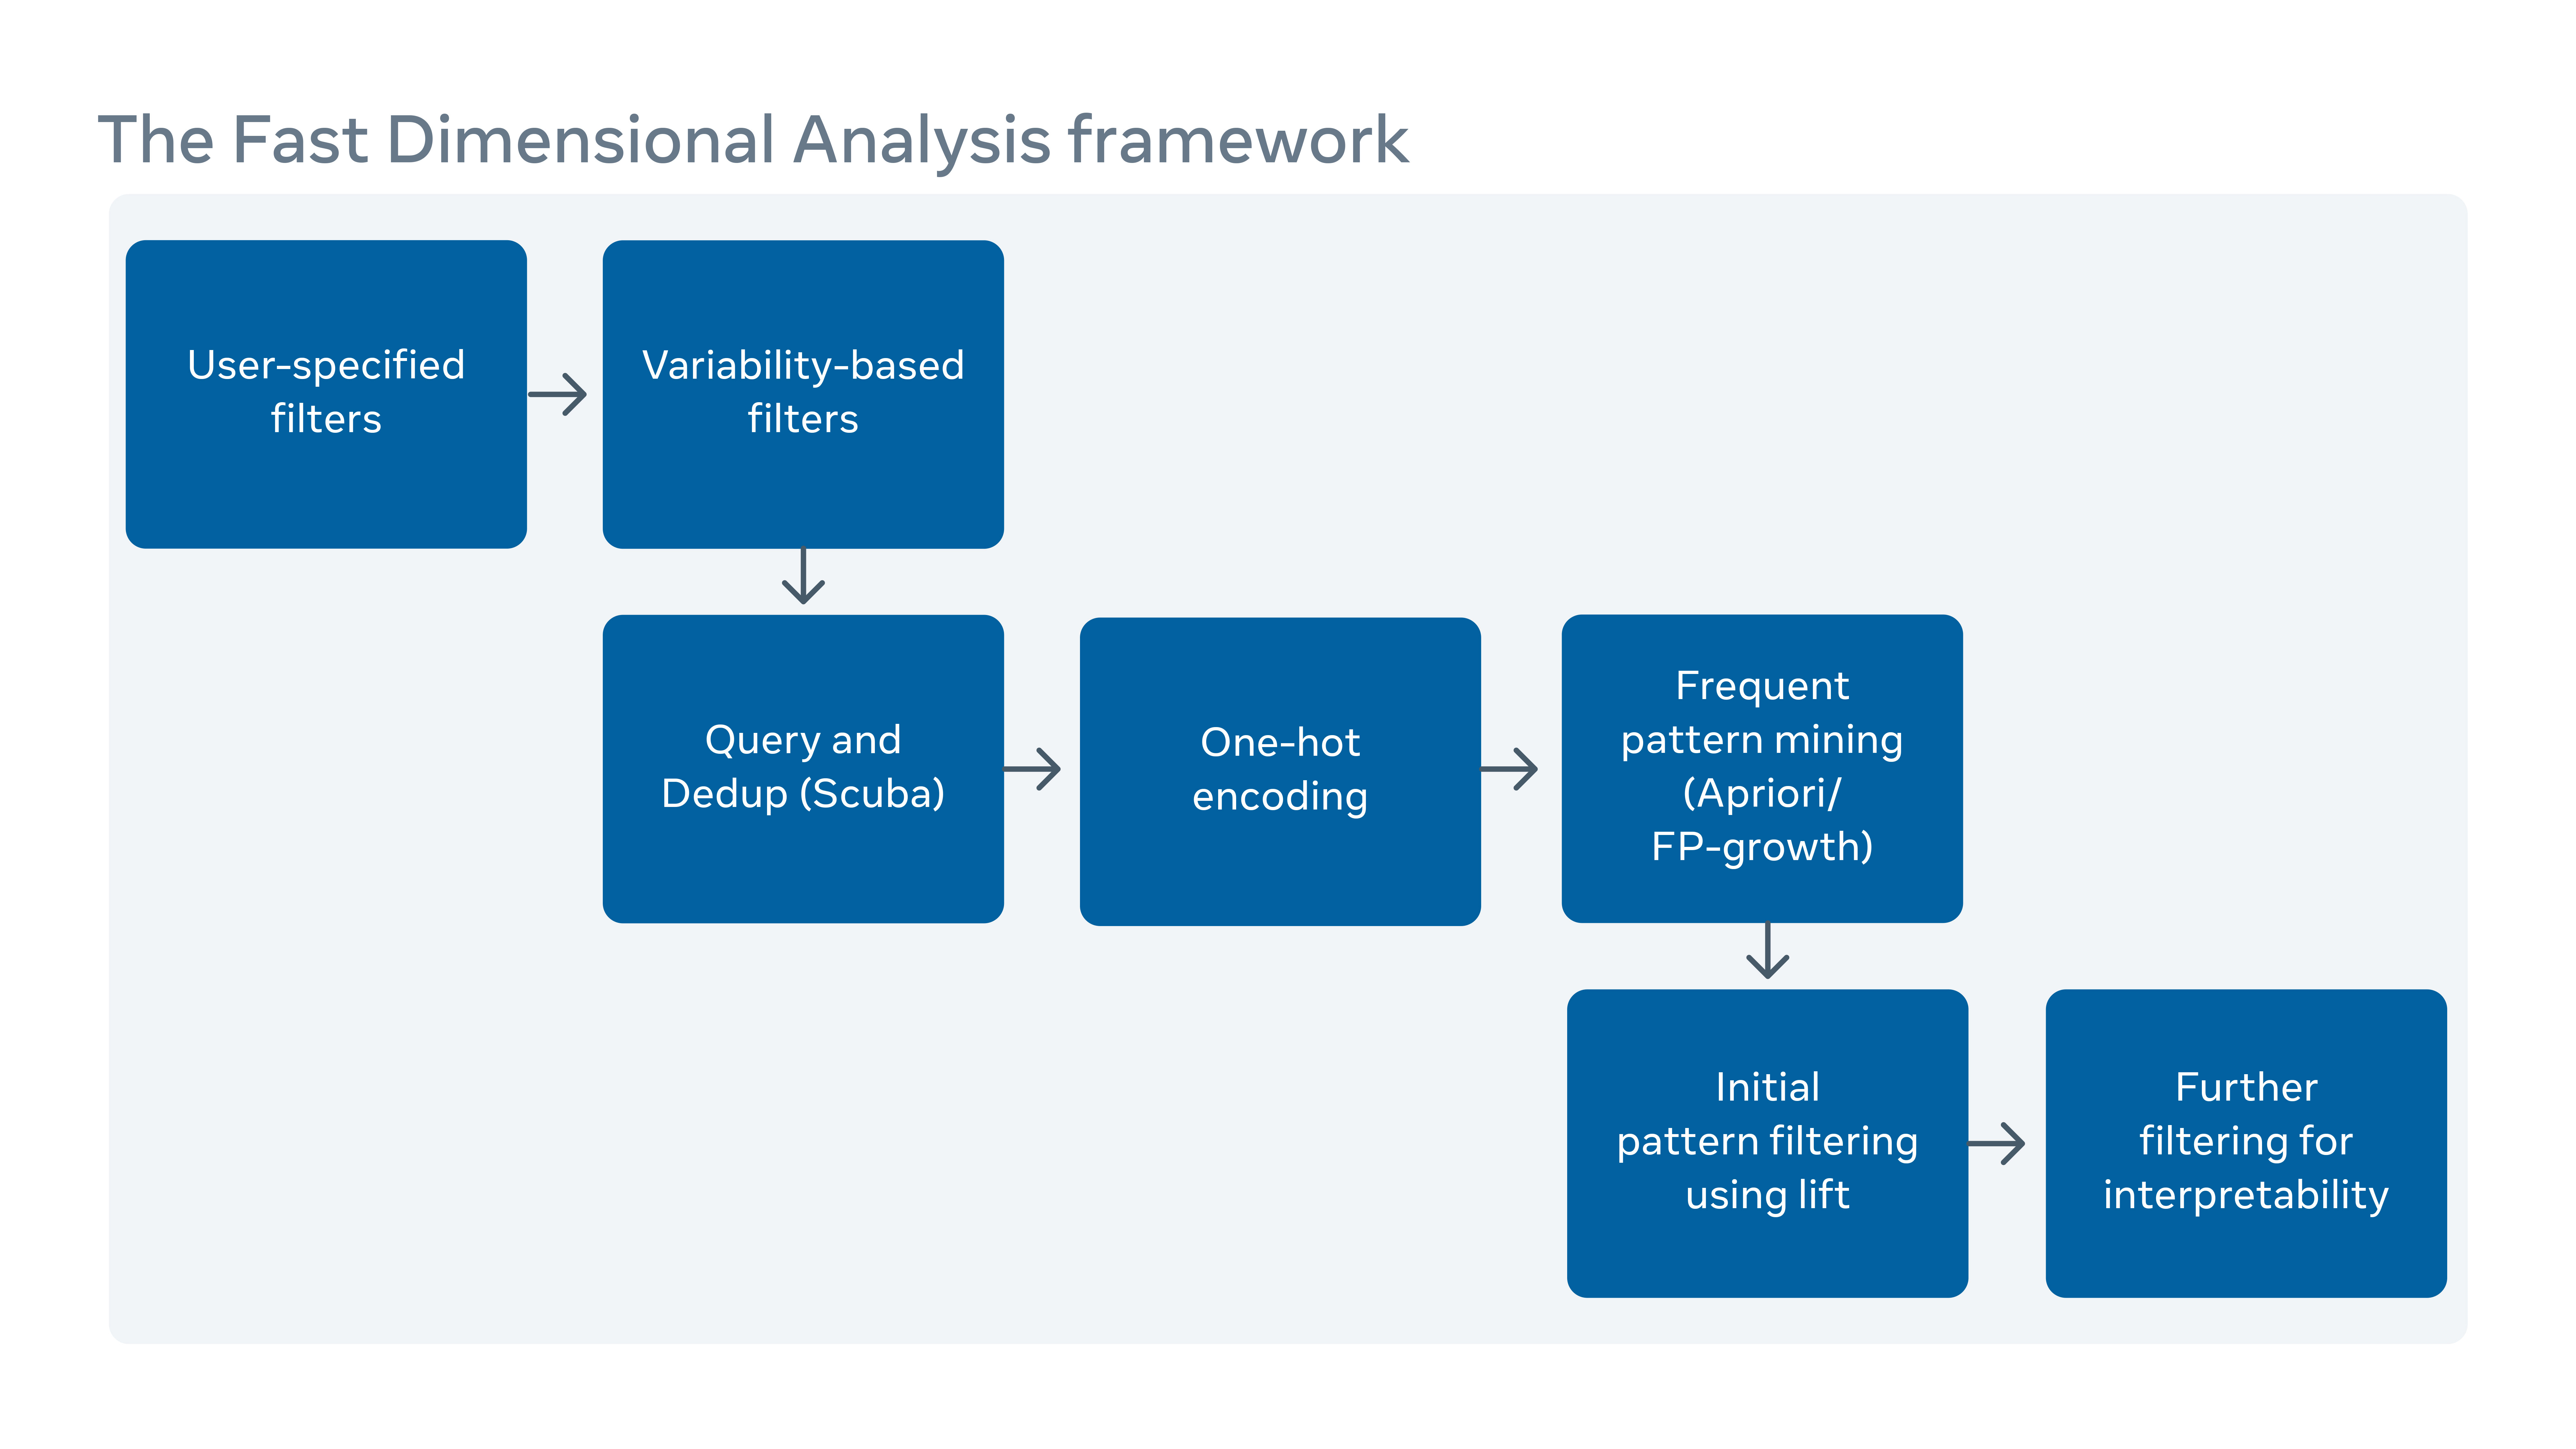
We implemented a scalable root-cause-analysis (RCA) tool that sorts through millions of log entries (each described by potentially hundreds of columns) to find easy-to-understand and actionable correlations.
With data pre-aggregation using Scuba, a realtime in-memory database, we significantly improved the scalability of a traditional pattern mining algorithm, FP-Growth, for finding correlations in this RCA framework. We also added a set of filters on the reported correlations to improve the interpretability of the result. We have deployed this analyzer widely inside Facebook for the RCA on hardware component failure rate, unexpected server reboots, and software failures.
You can read more in our paper, “Fast Dimensional Analysis for Root Cause Investigation in a Large-Scale Service Environment.”


