Facebook’s services are enabled by its massive underlying networking infrastructure. Keeping this network up and running is one of the top priorities for the infrastructure team. Our scale means that equipment failures can and do occur on a daily basis, and we work hard to prevent those inevitable events from impacting any of the people using our services. The ultimate goal is to detect network interruptions and automatically mitigate them within seconds. In contrast, a human-driven investigation may take multiple minutes, if not hours. Some of these issues can be detected using traditional network monitoring, usually by querying the device counters via SNMP or retrieving information via device CLI. Often, this takes time on the order of minutes to produce a robust signal and inform the operator or trigger an automated remediation response. Furthermore, in our practice we often encounter cases known as gray failures, where either the problem is not detectable by traditional metrics, or the device cannot properly report its own malfunctioning. All of these considerations inspired us to build NetNORAD – a system to treat the network like a “black box” and troubleshoot network problems independently of device polling.
Measuring loss ratio and latency
From an application’s perspective, the network has two major characteristics: packet loss ratio and latency. A change in these two affects the behavior of transport protocols, such as TCP. To measure these two metrics, we make Facebook’s servers ping each other, collect the packet loss statistics and RTT, and then infer network failures from this information. The two key components in this system are the pinger and responder processes, running on our servers. The pinger sends UDP probe packets to responders, and the latter receive, time-stamp, and send the probe back. The process happens in rounds, in which each pinger sends packets to all of its targets, collects the responses, and then repeats the procedure. We run multiple pinging processes, one for each different DSCP value that is used to tag different QoS classes in our network.
You may ask why we would choose UDP for network probing. Indeed, the vast majority of our traffic is conveyed by TCP, but when we started using stateless TCP probing (SYN-RST), we noticed that soliciting a TCP RST from target machines creates too much noise and confuses application monitoring systems. Stateful probing with TCP (SYN-SYN/ACK) is resource-intensive from the OS perspective, especially considering the number of probes needed to ensure coverage. We also ruled out ICMP because of possible polarization issues in ECMP scenarios (lack of entropy).
Our experience has been that, in the vast majority of cases, UDP and TCP share the same forwarding behavior in the network. At the same time, UDP is simpler and allows for direct measurement of underlying packet loss and network latency. The use of UDP also allows embedding custom information in the probes, such as multiple time-stamps to accurately measure the RTT. For the latter, we employ kernel time-stamps that allow us to compensate for latency caused by buffering in the Linux kernel, a common issue with end-to-end probing techniques.
Deploying the system
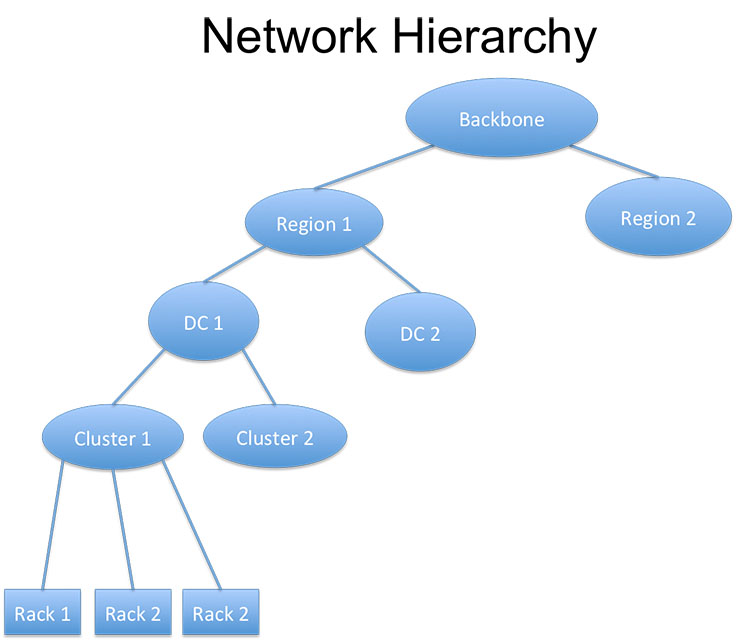
Facebook’s network is structured hierarchically. At the lowest level there are servers mounted in racks, which are organized in clusters. A collection of clusters housed in the same building and serviced by a common network form a data center (DC). The data centers in turn are aggregated via a network that interconnects them within the same region and attaches to the Facebook global backbone network. Facebook’s infrastructure spreads across multiple regions around the globe.
We deploy a small number of pingers in each cluster, but we run responders on all machines. Using a smaller number of pingers was a conscious choice, to reduce the volume of data we receive from probing so many targets. All pingers share a single global target list, which consists of at least two machines in every rack. The pingers can send packets quite fast, up to 1 Mpps, with the total aggregate probing rate on the order of hundreds of Gbps across the fleet.
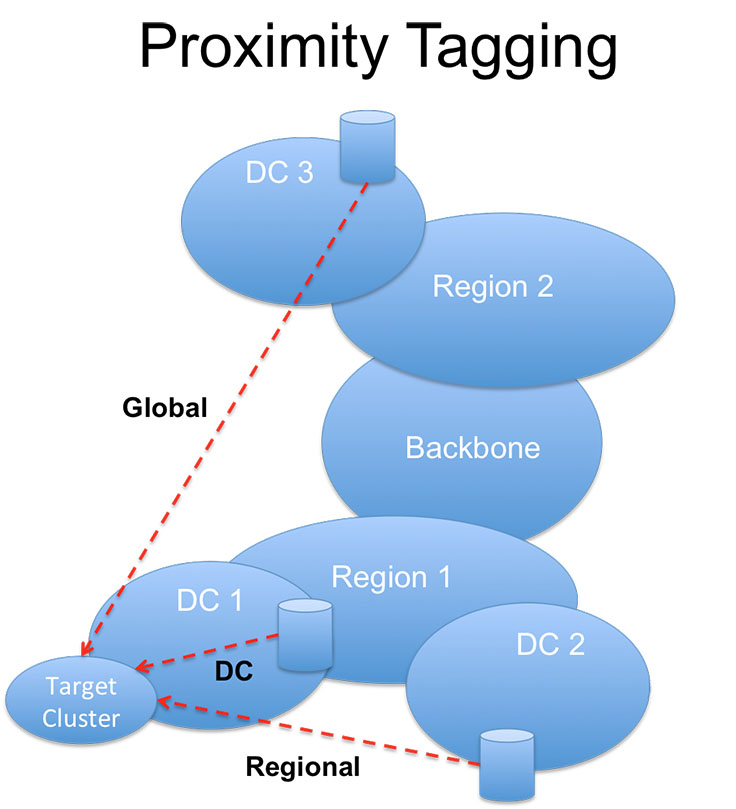
The hierarchical structure also allows us to simplify some data-aggregation techniques. When a pinger receives the responses in a given pinging round, it aggregates the results for machines that belong to the same cluster and tags them based on its proximity to the target cluster. For example, for cluster X with 1,000 targets, the pinger summarizes all loss stats across those hosts into a few values: average packet loss, loss variance, and percentiles of RTT across all responses returned. It then tags the result with a proximity tag, specifically:
- DC if the target cluster is in the same data center as the pinger.
- Region if the target is outside of the DC but within the same region.
- Global if the target is outside the pinger’s region.
Data processing
The results are time-stamped and written to Scribe, a distributed real-time logging system, and eventually make it to Scuba, a distributed in-memory store for data analysis and visualization. Scribe allows for multiple readers (aka tailers) to consume the information in publisher/subscribe fashion, and Scuba is just one of them.
We run a dedicated alarming process, which consumes the real-time data from Scribe and tracks packet-loss time series for each cluster/proximity tag combination. For each cluster/proximity pair, the process keeps track of how the packet loss is evolving by summing results from all the pingers. For example, for cluster X we’ll have three time series reflecting packet loss for the cluster from different viewpoints: DC, Region, and Global. These are coming from all pingers that consider themselves to be within the same data center, same region, and outside of the region respectively, relative to the probed cluster.
For each of the time series, we track percentiles over 10-minute intervals. Tracking multiple percentiles allows us to identify the nature of the events on our network. For example, a packet loss spike at the 50th percentile means there is likely a failure affecting the majority of traffic into or out of a cluster, while a large packet loss value at the 90th percentile would tell us there is a high level of loss affecting a small number of targets. For each of the percentile and proximity tag combinations, we set the rising and falling thresholds to trigger and clear a corresponding alarm.
An important factor in the design of this pipeline is the response time to detect a valid network failure. The Scribe write/read latency is usually in the order of seconds, and with time series tracking we typically see alarms raised in 20-30 seconds. This number has been critical to the success of the system in production, raising alerts as events occur. A larger delay would have made NetNORAD a good tool for historical loss tracking but reduced its impact as a front-line alerting system.
Fault isolation
It is not easy to tell whether packet loss is caused by an end-host failure or a genuine network issue, since those are indistinguishable from the perspective of end-to-end probing. To avoid massive storms of false positives caused by rebooting servers, the pinger implements outlier detection logic that helps find the targets reporting packet loss at too high a volume relative to the general population; the data from those targets is excluded from reporting. This technique is complemented by the scheduler process selecting targets only from known healthy machine sets, e.g., machines not posting alarms known to affect the machine’s connectivity.
Similar outlier detection logic applies to filtering the bad pingers: the processes running on machines that may have connectivity issues. The alarming process keeps track of the loss reported by each pinger for all clusters with the same proximity tag and marks a pinger bad if it reports loss that is too high relative to its peers. The samples from the bad pinger are then ignored until it stabilizes again.
Using proximity tagging, we can perform a basic form of fault isolation by running alarm correlation analysis. We follow two basic principles:
- If loss is reported to cluster at DC, Region, and Global proximity tags, then the fault is likely localized in the data center. This is the rule of root cause isolation.
- If all clusters within a data center report packet loss, then the issue is likely to be a layer above the clusters. This is the rule of downstream suppression.
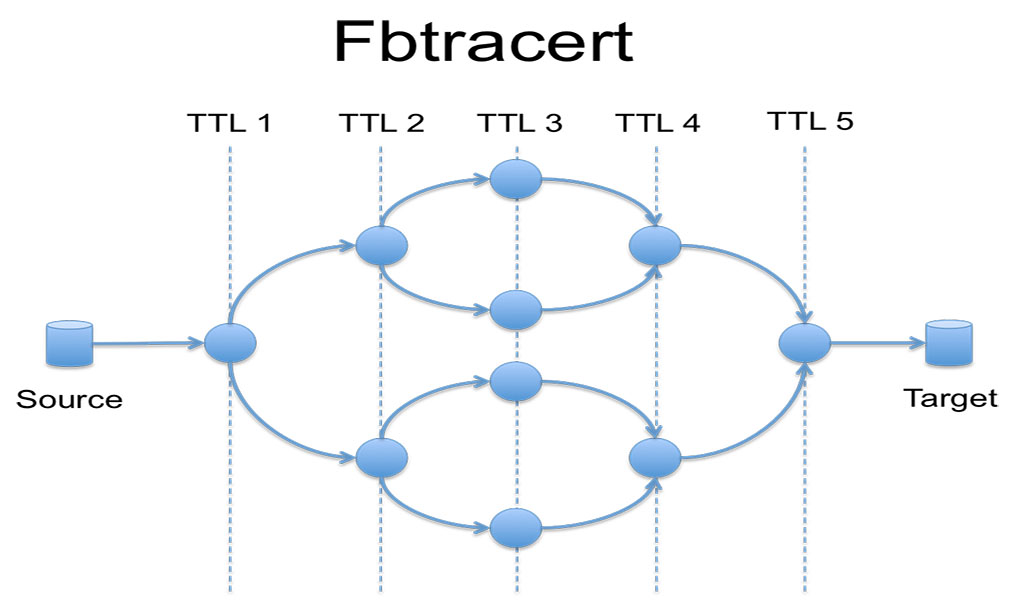
By applying these rules to the alarms, we can reduce their number and approximate the location of the failure. This does not, and cannot, determine the exact fault location. Just like with the common network troubleshooting process, in order to localize the fault, we need to run an additional tool, which we call fbtracert. Similar to the popular UNIX tool traceroute, fbtracert explores multiple paths between two endpoints in the network in parallel. In addition, it can analyze the packet loss at every hop and correlate the resulting path data to find the common failure point.
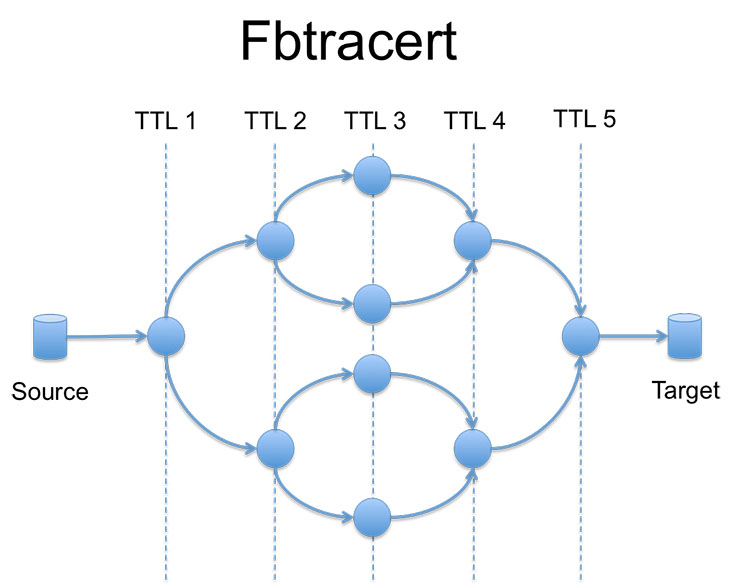
Being ad-hoc and effective in many cases, fbtracert is not universal. It has limitations caused by control-plane policing in network devices and various bugs with handling the traceroute probe packets—for example, responding with a wrong source IP address. It also does not work effectively in scenarios where the underlying forwarding paths are changing frequently, since it requires stable statistics per path, which is the case in some backbone networks.
In cases in which fbtracert can’t find a failure, we rely on active human involvement, which often starts with mining the end-to-end packet loss data that we store in Scuba with data filtering and grouping on various keys (e.g., ping source/target, protocol, QoS tag). As a result, we are continuing to work on exploring new methods of fault isolation to make it more robust and applicable in more cases.
Open-sourcing NetNORAD
We are open-sourcing some key components of the NetNORAD system to promote the concepts of end-to-end fault detection and to help network engineers around the world operate their networks. The first components are the pinger and responder (written in C++) and the fbtracert utility (written in Go). While this does not constitute a complete fault detection system, we hope you can use these components as a starting point, building upon them with your own code and other open source products for data analysis.
Thanks to the Network Infrastructure Engineering and Network Systems teams for making NetNORAD a reality.
