
This post describes some of the challenges we faced in collecting performance telemetry from our Android apps and how we approached them.
Here at Facebook we always strive to make our apps faster. While we have systems like CTScan to track performance internally, the Android ecosystem is far too diverse for us to test every possibility in the lab. So we also work to complement our testing data with telemetry from real phones in the hands of real people.
For the longest time, this telemetry was limited to painstakingly inserted code, indicating the beginning and end of some high-level action — for example, News Feed pull-to-refresh. An engineer would find the first touch event handler to start the marker and then a corresponding screen update location to end the marker. Over time we expanded these markers so data from multiple systems could be assembled into a single trace, but the level of detail was restricted to what the authors instrumented. In a sense, our work was very similar to the approach the Android Systrace tool took.
The primary problem with this approach is that you receive telemetry about only those things you could predict would influence performance. For example, networking and response parsing would clearly be part of this set of instrumentation, but you may have omitted the disk write that occurred due to a previous user action and that is now slowing down your well-instrumented code. We often found ourselves looking at outliers and regressions without having any data to explain why the metric regressed. What’s worse, instrumenting the code thoroughly was difficult due to the multi-threaded nature of the app and the highly asynchronous nature of user interactions. Every time the app submitted work to another thread, a little identifier would have to be handed over to stitch things together. Canceling markers and making sure things were connected correctly made the experience less than ideal.
Lastly, the speed of development at Facebook ensured that markers often “bit-rotted” — new code paths, changes to existing logic, and new exit points all had to be accounted for, but oversights often slipped through. As in any fast-moving environment, resilience to code changes is a desirable goal for us.
At this point, it’s worth discussing a few of the options we rejected:
- Use Android’s built-in profiling. Both Dalvik and ART come with method-level profilers, accessible from the `Debug` class. They can be triggered programmatically, and the output can be stored in a file of the engineer’s choosing. We discovered that the overhead of `startMethodTracing` was quite significant. To make matters worse, using this method disabled Dalvik’s JIT compiler in some versions of Android, slowing down the app even more. Overall, we decided that this tool would skew our data too much to be trustworthy. Lastly, while the recently introduced `startMethodTracingSampling` has existed for a while (it wasn’t public) and doesn’t skew measurements as much, we concluded that the causality issue this approach shares with stack traces is significant enough to make us question this direction.
- Vastly expand our manual instrumentation. This option, while viable, was deemed a last resort. In our experience, manual performance instrumentation is very time-consuming and error-prone. Engineer time is a precious resource, and ideally we wouldn’t waste it on something we can automate. Further, in a constantly changing code base, ensuring that this instrumentation is always correct takes a lot of effort. If we were to introduce a lot more instrumentation, the amount of effort to maintain it would likely become prohibitive.
So, we were left with this question: Can we automate performance instrumentation? We discovered that we can, to a degree.
A note of caution
Our work addresses needs that may not be the same for every app and engineer. Even internally, we encourage engineers to exhaust all available tools for local profiling before moving on to production telemetry. Nevertheless, there are issues that can be diagnosed only through this type of data, and we hope our experience can help guide others in designing a production profiling system that suits their needs. In particular, we believe the lessons we’ve learned in minimizing the runtime overhead are applicable to many projects, even if they don’t directly deal with performance telemetry.
Bytecode instrumentation
Our approach is inspired by previous research in this area, though we address a lot of Android-specific challenges. It also has a lot in common with aspect-oriented programming; however, we traded flexibility for execution speed of the compile process and conciseness of the rules.
At its core, the system relies on a rule-based bytecode rewriter (based on the ASM library) that matches code locations and injects or manipulates code. That is, after our Java code is compiled by javac to Java virtual machine bytecode, but before it is passed on to dx to convert to the Dalvik VM format, we intervene and modify the JVM bytecode.
The bytecode rewriter runs on the full Java bytecode of our application, as part of our build system, and executes a small number of simple transformations, resulting in a substantial number of rewritten code locations (since every rule will match more than one location). For example, this is a rule that will instrument the life cycle callbacks of all Activities in our application by injecting code at the entry and exit points of the specified methods:
new EntryExitRule.Builder()
  .setMatcherConfiguration(
    subclassesOf(
      getObjectType("android/app/Activity")
    ).withMethods(
      getMethod("void onCreate(android.os.Bundle)"),
      getMethod("void onRestart()"),
      getMethod("void onStart()"),
      getMethod("void onResume()"),
      getMethod("void onPause()"),
      getMethod("void onStop()"),
      getMethod("void onDestroy()")))
  .setDetourType(LOG_UTILS_TYPE)
  .setDetourMethodEntry(LOG_METHOD_ACTIVITY_START)
  .setDetourMethodExit(LOG_METHOD_ACTIVITY_END)
  .setCategory(Categories.LIFECYCLE)
  .build()
At runtime, these methods will log one or more instrumentation events in a way that allows us to efficiently assemble them in a single trace file.
The initial granularity we targeted was at the level of framework calls and callbacks. That is, we instrumented how our app interacts with the Android framework and how the framework in turn calls into our app. This level of granularity is surprisingly useful, since the interactions between the different life cycles of the app’s components have a huge influence on runtime performance.
Further, because the instrumentation is automated, we can be more confident in its correctness (assuming the rewriter and its rules are correct) and do not have to worry as much about code changes breaking the instrumentation. An entire class of correctness problems, such as forgetting to stop markers when a method throws an exception, can be handled either fully or semiautomatically — new exit points are automatically accounted for and new overrides are automatically instrumented, all without polluting the codebase with boilerplate code.
Async stack traces
One of the key capabilities we win by using bytecode instrumentation is the ability to transparently handle asynchronous tracing. Namely, we can automatically pass enough context between threads so that we can stitch together the logical control flow. This can be expressed as a series of rules that change how the app will use APIs that submit work to other threads. These interactions will be manipulated at runtime to pass our context to reassemble the execution. For example, here’s a rule that targets the Handler API:
RedirectionRule.builder()
  .setMatcherConfiguration(
    subclassesOf(
      getObjectType("android/os/Handler")
    ).withMethods(
      getMethod("boolean post(Runnable)"),
      getMethod("boolean postAtFrontOfQueue(Runnable)"),
      getMethod("boolean postAtTime(Runnable, Object, long)"),
      getMethod("boolean postAtTime(Runnable, long)"),
      getMethod("boolean postDelayed(Runnable, long)"),
      getMethod("void removeCallbacks(Runnable)")))
  .setDetourClass("com/facebook/tools/dextr/runtime/detour/HandlerDetour")
  .setCategory(Categories.ASYNC)
  .build()
While there are countless ways to switch control between threads, in practice we found that a small set of rules accounted for the overwhelming majority of asynchronicity in our apps.
By amending the work object to refer to its originating thread, we can generate a trace from the UI click to the subsequent notifyDataSetChanged, spanning all the threads in between:
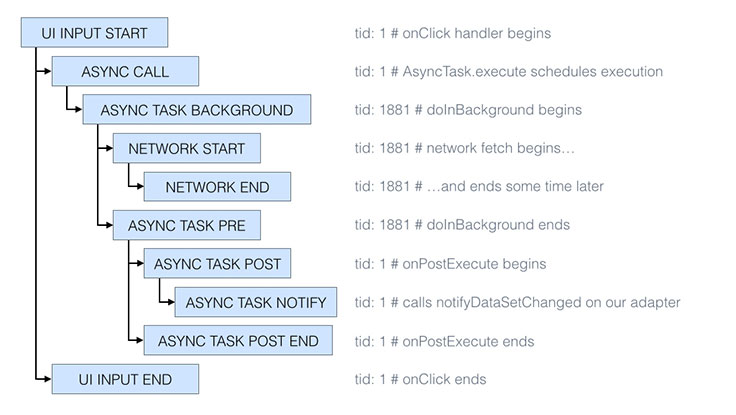
There are two main things to notice in this simplified trace (we have omitted timestamps and other metadata for brevity):
- The thread ID (
tid) changes from 1 to 1881 and then back to 1, indicating that the logical flow moved to a background thread and then back to the main thread. Indeed, from the Android documentation we know thatAsyncTask.doInBackgroundruns in a background thread. - The
UI INPUT ENDevent happens afterASYNC CALLbut not necessarily before or afterASYNC TASK BACKGROUND. That is, in this view of the trace, we focus on the structure of the execution flow, which can make reasoning about the order of two arbitrary events less intuitive (we would have to compare their timestamps ourselves instead of relying on visual cues).
Chronologically, the execution actually looks like this:
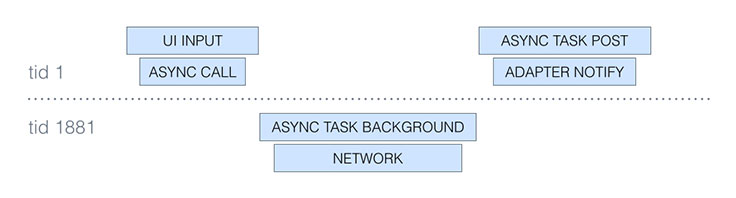
Overall, the ability to trace across threads opens the door to a deeper understanding of the execution flow and can expose subtle performance bugs, such as scheduling delays and unnecessary async jumps.
Along the way, we had to deal with a variety of problems. In no particular order, here are a few interesting issues we needed to overcome:
- Even with object pooling, representing each event as a Java object quickly became a bottleneck. The performance impact of garbage collection is proportional to the number of objects alive, and our object pool had thousands of small objects in it. Further, if the pool ran dry, an app thread would have to allocate the entry itself (or just decide to drop it), which disproportionately punished the UI thread containing the most instrumentation. This was one of the main reasons behind the decision to switch to native code, where we could reliably pre-allocate and reuse memory.
- One of the more difficult design decisions we had to deal with was the need to have a single global stream of instrumentation events. We considered having thread-local buffers, but sadly there was no easy way to be notified of thread exit/death, so flushing these buffers in the edge cases proved to be problematic.
- The decision to have a single buffer, combined with the different priorities of the threads in our app, made for an interesting multithreading challenge. The varying priorities (UI thread having the highest, our worker thread taking events from the buffer having the lowest) meant priority inversion was all too common, and it was affecting performance. We tried using priority-inheriting mutexes, but we discovered that the frequent and rather heavy interactions with the kernel could easily become the bottleneck.
- Ultimately, we settled on a custom lock-free ring buffer of fixed-size events, which now lives in folly. One of the significant benefits of a lock-free solution was that, in the majority of cases, events could be written without having to make system calls into the kernel, which made the operation highly efficient and addressed the bottlenecks we discussed in the previous point.
- Using only primitive types and keeping things simple pays off. When the bytecode rewriter manipulates the app’s code, it also injects a unique identifier at each code location it touches. As part of the build process, it also generates a mapping between identifiers and code locations. This allows us to log only 32-bit integer identifiers at runtime and to symbolicate them to code locations on the server side, sidestepping having to ask the VM what the top stack frame is. It also allows us to make the events fixed-size and very small (around 50 bytes per event), which has an effect on both the trace size and the runtime overhead.
- Balancing the code size impact is a delicate game. Every code location where the rewriter injects code increases the overall app size by a few bytes. If it’s only a few hundred locations, you probably won’t notice. However, it’s all too easy to write a simple rule that instruments far too much code, bloating the app size as a result. Continuously monitoring the size impact is important to quantify the overhead of new rules and push back on the code size increase.
Future development
In summary, bytecode rewriting has allowed us to scale up our performance instrumentation, providing unique insights into the execution at runtime. It has required a lot of work to make performant, but the effort has so far been worth it.
We’re still actively developing this system, integrating it with existing instrumentation and configuration methods. It’s still in its early days, but we’re very excited by the results we’ve seen and are already thinking of new problems to solve outside the scope of client-side performance.


