We recently released a new version of Flashcache, kicking off the flashcache-3.x series. We’ve spent the last few months working on this new version, and our work has resulted in some performance improvements, including increasing the average hit rate from 60% to 80% and cutting the disk operation rate nearly in half.
History of Flashcache at Facebook
Facebook first started using Flashcache in 2010. At the time, we were trying to find a way around having to choose between a SAS or SATA disk-based solution and a purely flash-based solution. None of the options were ideal: The SAS and SATA options in 2010 were slow (SATA) or required many disks (SAS), and the cost per gigabyte for flash in 2010 was high.
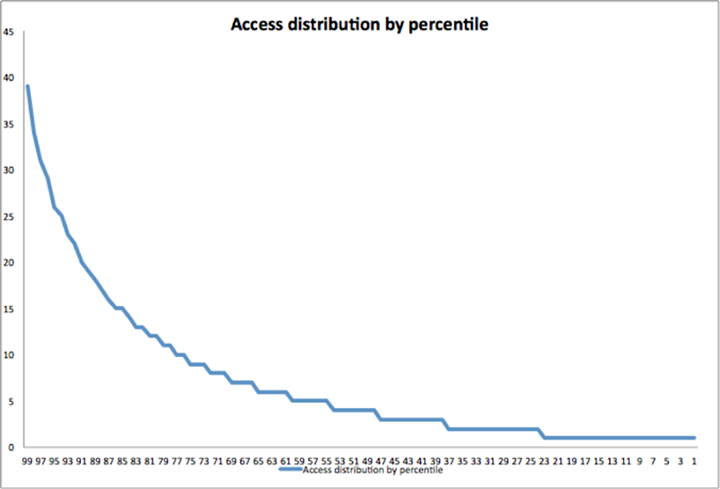
One possible solution to this would have been to split our databases into multiple tiers – a handful of tiers that handle the most active data and need high-performance hardware, and others that handle colder data and can run on lower-performance gear. This would have been technically possible,as our data access patterns typically conform to a Zipfian distribution: Even with all the RAM-based caches we use (memcache, TAO, InnoDB buffer pool, etc.), hot data is usually accessed 10x more than average data. But such a solution would have been relatively complex, and at our scale additional complexity is less desirable.
Looking at this in 2010, we saw an opportunity to try to solve this problem at the software layer. We evaluated adding support for an L2 cache directly into InnoDB, but concluded it was better to make it transparent to applications like MySQL. So we instead implemented Flashcache as a Linux kernel device mapper target and deployed it into production on a large scale.
Peformance analysis and optimization
In the years that followed, the performance profile of our systems changed: InnoDB compression allowed us to store more logical data demanding more IOPS, and we moved various archival bits to other tiers and optimized our data to consume less space while maintaining accessibility. The number of disk operations required for our workload increased, and we saturated the disk IO limits on some servers. Given this, we decided to take a deeper look at Flashcache performance in production to understand whether we could make it more efficient.
The performance characteristics of different disk drive types is driven by several different factors, including the rotational speed of the disk, the speed at which the head moves, and the number of reads that can be squeezed into a single rotation. In the past, SATA drives have generally performed worse than enterprise SAS components, so we wanted to come up with optimizations in our software stack to be able to utilize our systems efficiently.
Though in most cases tools like ‘iostat’ are useful to understand general system performance, for our needs we needed deeper inspection. We used the ‘blktrace’ facility in Linux to trace every request issued by database software and analyze how it was served by our flash- and disk-based devices. Doing so helped identify a number of areas for improvement,including three major ones: read-write distribution, cache eviction, and write efficiency.
1. Read-write distribution
Our analysis showed that a few regions on disk accounted for the majority of writes, and the distribution of reads was very uneven. We added more instrumentation in Flashcache to learn about our workload patterns and get better metrics on caching behavior.
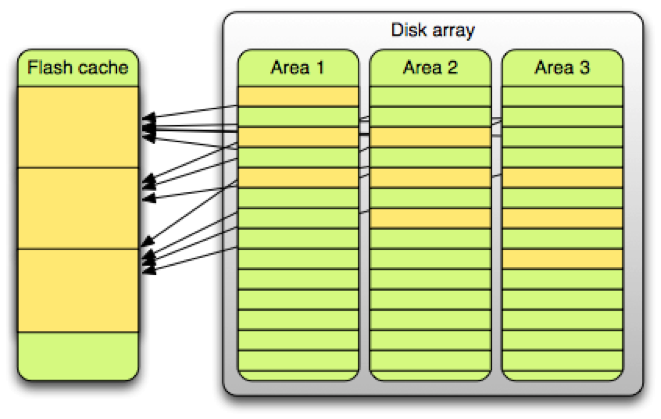
Our situation looked like this from a high level:
To simplify cache maintenance operations our cache device was split into many small (2MB) sets, and 2MB segments from overall storage were linearly mapped to the cache. However, this architecture resulted in hot tables being collocated in the same cache sets and colder tables occupying other sets that were mostly idle. (This is not unlike the “birthday paradox,” in which –contrary to most people’s expectations – there’s a 50 percent chance that two people in a group of at least 23 will share a birthday.)
Fixing such a problem required either a fancy collocation algorithm that would take small segment cacheability into account, or an increase in the variety of data in a set. We chose the latter, by implementing relatively simple policy changes:
- Decreased disk-side associativity size from 2MB to 256KB (using RAID stripe sized clustering)
- Changed flash-side associativity size from 2MB to 16MB (4096 pages per set instead of 512)
- Moved to random hashing instead of linear mapping
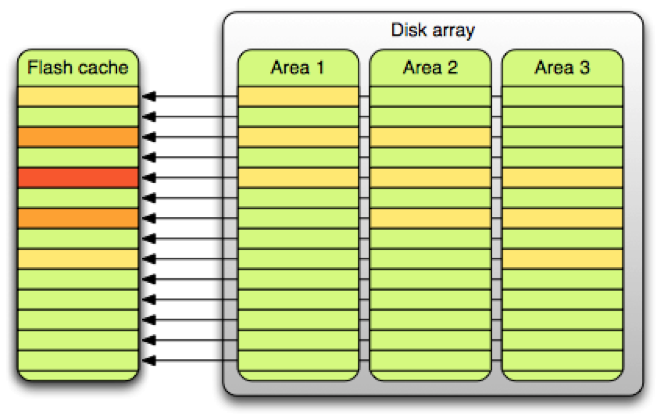
These changes dispersed our hot data over more of the cache. The picture below showcases some of the benefit:

Before this change, 50% of the cache accounted for 80% of the disk operations. After this change, 50% of the cache accounted for 50% of the disk operations.
2. Cache eviction
Our database servers use small logical block sizes – 4KB or 8KB for compressed InnoDB tables, and 16KB for uncompressed. When we were using 2MB cache sets we did not see big differences between various cache eviction algorithms and chose FIFO instead of LRU. The workload changed after we increased the Flashcache set sizes, so we began evaluating alternatives to FIFO.
We didn’t need to build out full implementations to model different cache eviction algorithm behaviors, as we could use traces provided by blktrace subsystem. Eviction algorithms tend to be very simple – they have to be, since they govern all the actions going through the cache. An LRU decorator for Python took less than 20 lines to implement, and adding mid-point insertion capabilities increased the code by another 15 lines (an example can be found here). We ended up writing simple simulators to model different behaviors of eviction algorithms on our collected data, and found that LRU with mid-point insertion was effective –but we still needed to determine the best mid-point in the LRU to insert newly read blocks.
What we found was that blocks that are referenced multiple times are promoted and moved from the mid-point to the head of the LRU. If we put them at the head of the LRU when they’re first read, then many blocks that are read once will push more frequently read pages from the LRU. If we put them in the middle of the LRU (halfway from the head), then they’d be at the 50th percentile. If we put them at the head, then they’d be at the 0th percentile.
In this chart, we see that the cache is effective until the insertion point is at the 85th percentile or greater, when the cache stops working:
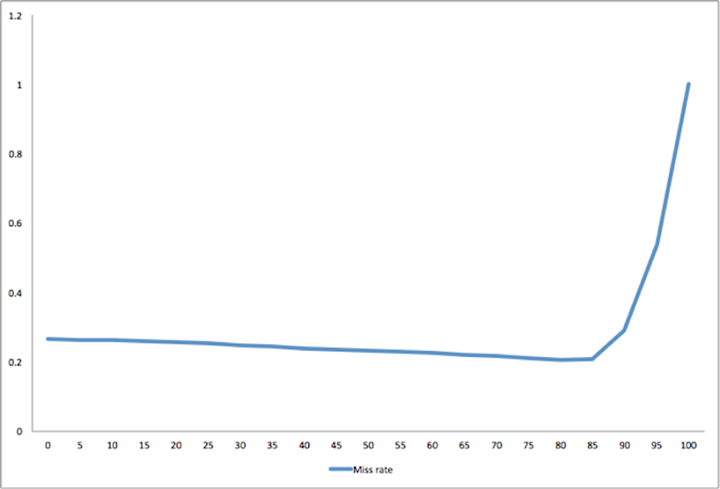
This behavior is workload-specific, and understanding it has allowed us to make Flashcache more effective. We are currently running Flashcache with the mid-point (implemented as LRU-2Q) insertion set to the 75th percentile. This is a conservative setting that allows for 25% old pages but is still better than standard LRU, as operational actions like rebuilding or migrating instances caused cache behavior changes that were not foreseen in our initial performance modeling.
We run multiple database instances per machine, and the one that’s been running longest gets preferential treatment in the well established old pages area, while new ones never get out of the nursery.
3. Write efficiency
Another issue we wanted to address was disk write efficiency. Flashcache can act as a reliable write-behind cache, and many writes to disk can be merged beforehand on flash.
Previously, we just tried to enforce a fixed percentage of dirty pages per cache set. Since different cache sets have different behaviors,under this model we ended up either underallocating or overallocating cache to modified pages. Some segments were written out constantly, while others cached dirty pages for a week, which penalized read caching.
To address this, we implemented a straightforward dirty data eviction method that did not segregate write and read operations. In the new method, all pages are treated equally, and if cache wants to reclaim a page, it just looks at the oldest entries in the LRU. If the oldest entry is dirty, cache would schedule a background eviction of that entry and then reclaim the next clean one and use it for new data.
This smoothed out our write operations while preserving maximum write-merging efficiency and instant write capabilities of write-behind cache. It also increased amount of space that can be used for reads, increasing our overall cache efficiency.
Future work
With these three changes implemented, we are now turning our attention to future work. We’ve already spent some time restructuring metadata structures to allow for more efficient data access, but we may still look at some changes to support our next-generation systems built on top of multi-TB cache devices and spanning tens of TB of disk storage. We’re also working on fine-grained locking to support parallel data access by multiple CPU cores.
Also, while the cost per GB for flash is coming down, it’s still not where it needs to be, and this introduces more complexities into capacity planning. SSDs have limited write cycles, so we have to make sure that we’re not writing too much. Every cache miss results in a flash data write, so having flash devices that are too small may be problematic. In this case it’s nice to have hard disks that aren’t too fast, as any cache hierarchy has to depend on steep performance differences between multiple levels.
With these improvements, Flashcache has become a building block in the Facebook stack. We’re already running thousands of servers on the new branch, with much-improved performance over flashcache-1.x. Our busiest systems got 40% read I/O reduction and 75% write I/O reduction, allowing us to perform more efficiently for more than a billion users with a flip of a kernel module.
Please check out the flashcache-3.x series on GitHub and let us know what you think.
Domas Mituzas is a production database engineer at Facebook.
