
- We’ve open-sourced MemLab, a JavaScript memory testing framework that automates memory leak detection.
- Finding and addressing the root cause of memory leaks is important for delivering a quality user experience on web applications.
- MemLab has helped engineers and developers at Meta improve user experience and make significant improvements in memory optimization. We hope it will do the same for the larger JavaScript community as well.
In 2020, we redesigned Facebook.com as a single-page application (SPA) that does most of its rendering and navigation using client-side JavaScript. We used a similar architecture to build most of Meta’s other popular web apps, including Instagram and Workplace. And while this architecture allows us to provide faster user interactions, a better developer experience, and a more app-like feel, maintaining the web app state on the client makes effectively managing client-side memory more complex.
People using our web apps will often notice performance and functional correctness issues immediately. A memory leak, however, is a different story. It isn’t immediately perceivable, because it eats up a chunk of memory at a time — affecting the entire web session and making subsequent interactions slower and less responsive.
To help our developers address this, we built MemLab, a JavaScript memory testing framework that automates leak detection and makes it easier to root-cause memory leaks. We’ve used MemLab at Meta to successfully contain unsustainable memory increases and identify memory leaks and memory optimization opportunities across our products and infra.
We’ve already open-sourced MemLab on GitHub, and we’re excited to work with the JavaScript community and have developers start using MemLab today.
Why we developed MemLab
Historically, we spent a lot of time measuring, optimizing, and controlling page load and interaction time, as well as JavaScript code size. We built automated systems that alerted us when there were regressions in these metrics — both before and after code landed in production — so that we could act quickly to fix these issues and prevent the changes from ever landing in production.
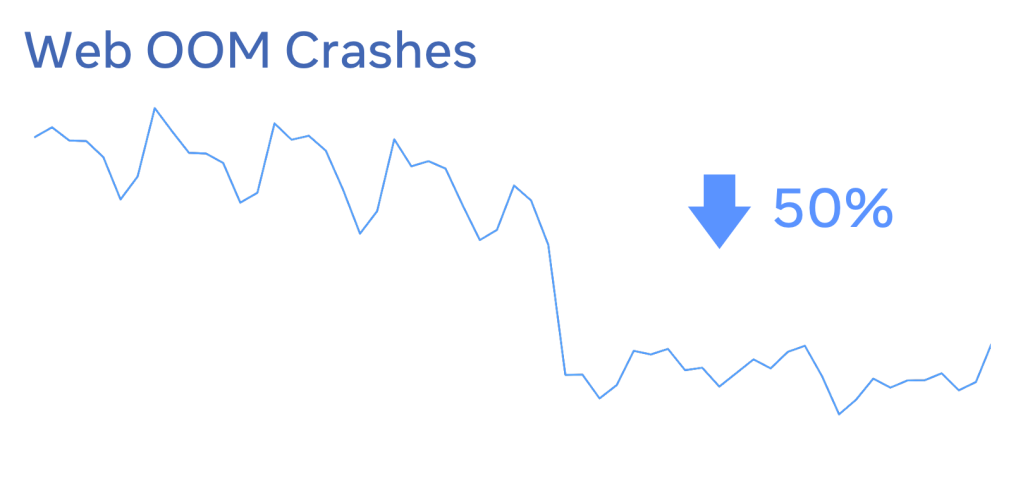
Comparatively, we hadn’t done much work for managing web in-browser memory. And when we analyzed the new Facebook.com’s memory usage, we found that both memory usage and the number of out-of-memory (OOM) crashes on the client side had been climbing.
High memory usage has a statistically significant and negative impact on:
- Page load and interaction performance (how much time it takes to load a page or perform an interaction)
- User engagement metrics (active users, time spent on site, number of activities performed)
What causes high memory usage in web applications?
Because memory leaks aren’t usually obvious, they seldom get caught in code review, are hard to spot during development, and are often difficult to root-cause in production. But mainstream JavaScript runtimes all have garbage collectors, so how is memory leaking in the first place?
JavaScript code can experience memory leaks by keeping hidden references to objects. Hidden references can cause memory leaks in many unexpected ways.
For example:
var obj = {};
console.log(obj);
obj = null;
In Chrome, this code leaks obj even though we set the reference to null. This happens because Chrome needs to keep an internal reference to the printed object so that it can be inspected in the web console later (even if the web console is not opened).
There can also be cases where memory is not technically leaked but grows linearly and unbounded during a user session. The most common causes of this are client-side caches that don’t have any eviction logic built in and infinite scroll lists that don’t have any virtualization to remove earlier items from the list as new content is added.
We also didn’t have automated systems and processes in place to control memory, so the only defense against regressions was experts periodically digging into memory leaks via Chrome DevTools, which was not scalable considering we’re shipping a nontrivial number of changes every day.
How MemLab works
In a nutshell, MemLab finds memory leaks by running a headless browser through predefined test scenarios and diffing and analyzing the JavaScript heap snapshots.
This process happens in six steps:
1. Browser interaction
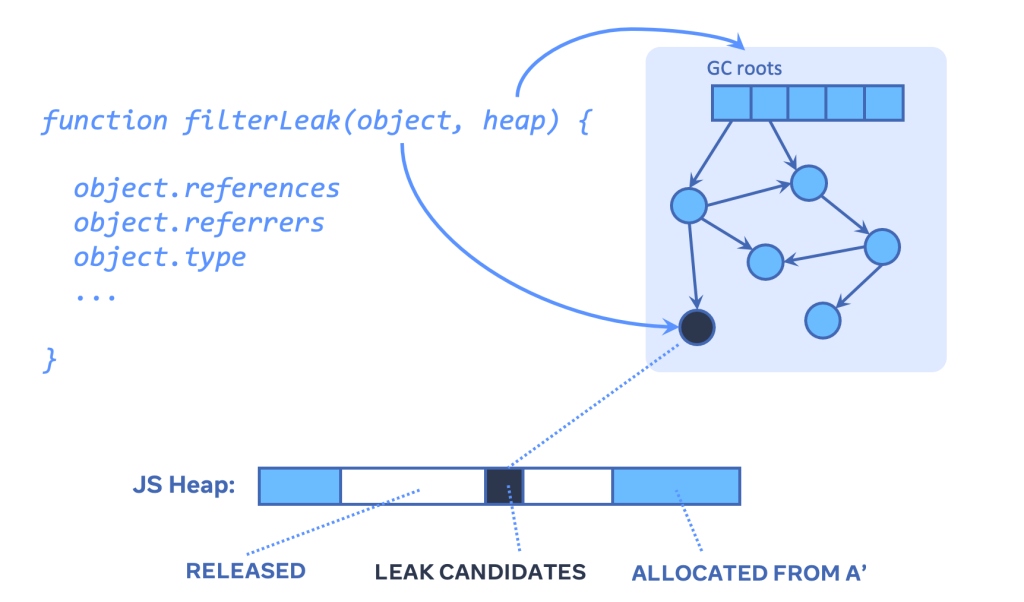
To find leaked objects on a target page (B). MemLab automates a browser using Puppeteer and visits the test pages in the following order:
- Navigate to a different tab (A) and get heap SA.
- Navigate to the target page (B) and get heap SB.
- Come back to the previous page (A’) and get heap SA’.
2. Diffing the heap
When we navigate to a page and then navigate away from it, we would expect most of the memory allocated by that page to also be freed — if not, it is highly suggestive of a memory leak. MemLab finds potential memory leaks by diffing the JavaScript heap and recording the set of objects allocated on page B that weren’t allocated on Page A but are still present when Page A is reloaded. Or, more formally, the superset of objects leaked from the target page can be derived as (SB \ SA) ∩ SA’ ).
3. Refining the list of memory leaks
The leak detector further incorporates framework-specific knowledge to refine the list of leaked objects. For example, Fiber nodes allocated by React (an inner data structure React uses for rendering the virtual DOM) should be released when we clean up after visiting multiple tabs.
4. Generating retainer traces
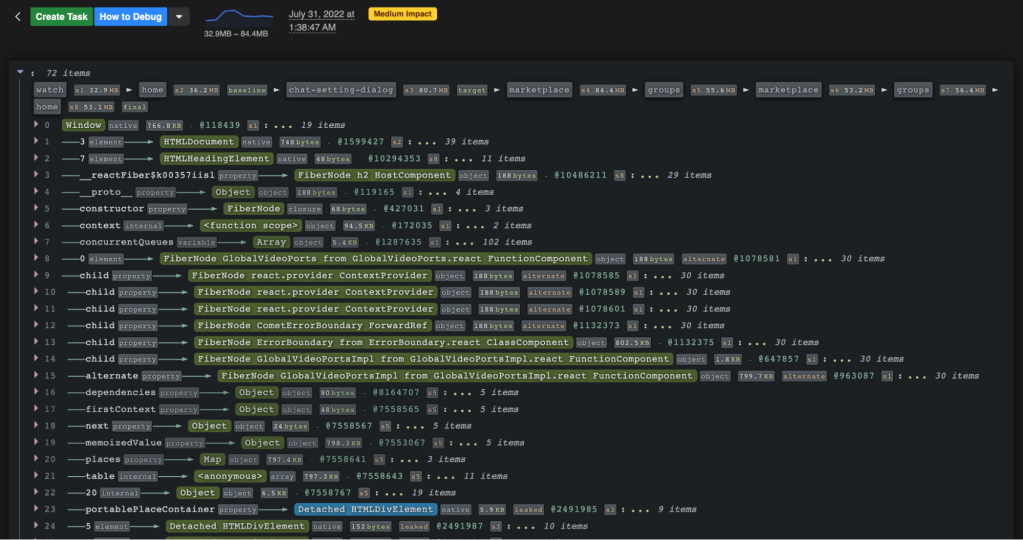
MemLab traverses the heap and generates retainer traces for each leaked object. A retainer trace is an object reference chain from the GC roots (the entry objects in a heap graph from which garbage collectors traverse the heap) to a leaked object. The trace shows why and how a leaked object is kept alive in memory. Breaking the reference chain means the leaked object will no longer be reachable from the GC root and therefore can be garbage collected. By following the retainer trace one step at a time, you can find the reference that should be set to null (but wasn’t, due to a bug).
5. Clustering retainer traces
Sometimes certain interactions can trigger thousands of leaked objects. It would be overwhelming to show all the retainer traces in this case. MemLab clusters all retainer traces and shows one trace for each cluster of leaked objects that share similar retainer traces. The trace also includes debug information, such as dominator nodes and retained sizes.
6. Reporting the leaks
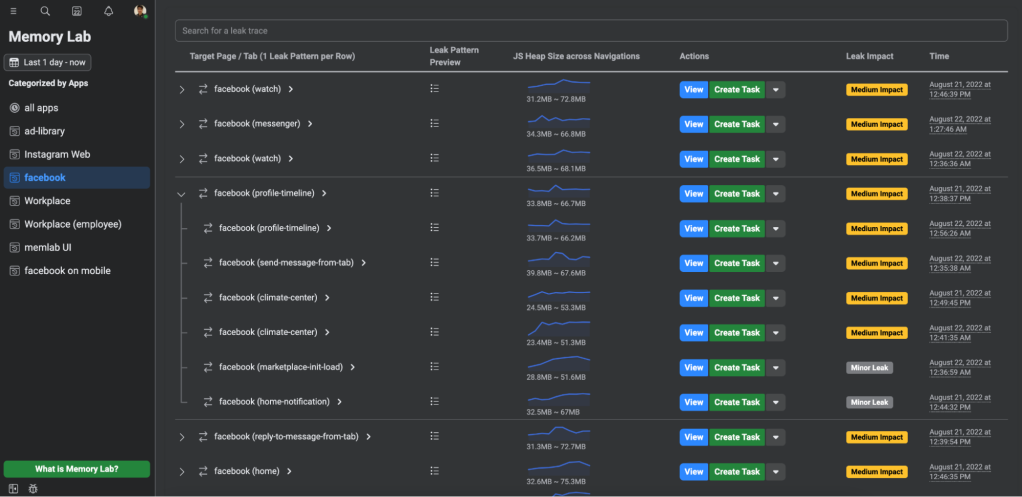
We run MemLab at regular intervals throughout the day to get a continuous signal on memory regressions. Any new regressions are added to an internal dashboard, where clustered retainer traces of all memory leaks detected are gathered and categorized. Developers can then click and view the properties of objects on the retainer trace of each memory leak.
(Note: This dashboard is not part of the open source release of MemLab, but something similar could be added to any CI/CD pipeline.)
MemLab’s features
Memory leak detection
For in-browser memory leak detection, the only input MemLab requires from developers is a test scenario file that defines how to interact with the webpage by overriding three callbacks with the Puppeteer API and CSS selectors. MemLab automatically diffs the JavaScript heap, refines memory leaks, and aggregates results.
Graph-view API of JavaScript heap
MemLab supports a self-defined leak detector as a filter callback that is applied to each leak candidate object allocated by the target interaction but never released afterwards. The leak filter callback can traverse the heap and decide which objects are memory leaks. As an example, our built-in leak detector follows the return chain of a React Fiber node and checks if the Fiber node is detached from the React Fiber tree.
To allow the context of each candidate leak to be analyzed, MemLab provides a memory-efficient graph view of the JavaScript heap. This enables querying and traversing the JavaScript heap without having any domain knowledge about V8’s heap snapshot file structure.
In the graph view, each JavaScript object or native object in the heap is a graph node, and each JavaScript reference in the heap is a graph edge. The heap size of a real application is often large, so the graph view needs to be memory-efficient while providing an intuitive object-oriented heap-traversal API. Therefore, the graph nodes are designed to be virtual and not interconnected through JavaScript references. When the analysis code traverses the heap, the virtual graph view partially constructs the touched section of the graph just-in-time. Any part of the graph can be easily deallocated since those virtual nodes do not have JavaScript references to each other.
The heap graph view can be loaded from JavaScript heap snapshots taken from Chromium-based browsers, Node.js, Electron, and Hermes. This allows for complex patterns to be analyzed and answers questions such as, “How many React Fiber nodes are alternate Fiber nodes, which are used in incomplete concurrent renders?” or “What is the total retained size of unmounted react components?”.
import {getHeapFromFile} from '@memlab/heap-analysis';
const heapGraph = await getHeapFromFile(heapFile);
heapGraph.nodes.forEach(node => {
  // heap node traversal
  node.type
  node.references
);
Memory assertions
A Node.js program or Jest test can also use the graph-view API to get a heap graph view of its own state, to do self-memory checking, and write all kinds of memory assertions.
import type {IHeapSnapshot} from '@memlab/core';
import {config, takeNodeMinimalHeap, tagObject} from '@memlab/core';

test('memory test', async () => {
  config.muteConsole = true;
  const o1 = {};
  let o2 = {};

  // tag o1 with marker: "memlab-mark-1", does not modify o1 in any way
  tagObject(o1, 'memlab-mark-1');
  // tag o2 with marker: "memlab-mark-2", does not modify o2 in any way
  tagObject(o2, 'memlab-mark-2');

  o2 = null;

  const heap: IHeapSnapshot = await takeNodeMinimalHeap();

  // expect object with marker "memlab-mark-1" exists
  expect(heap.hasObjectWithTag('memlab-mark-1')).toBe(true);

  // expect object with marker "memlab-mark-2" can be GCed
  expect(heap.hasObjectWithTag('memlab-mark-2')).toBe(false);

}, 30000);
Memory toolbox
In addition to memory leak detection, MemLab includes a set of built-in CLI commands and APIs for finding memory optimization opportunities:
- Break down heap by object shapes (e.g., {arguments, postRun, preRun, quite, thisProgram, …}) instead of classifying objects based on constructor names (e.g., Object). This is useful to quickly detect and root-cause significant memory used by object literals.
- Detect continuous individual object growth or object shape growth. MemLab can take a series of heap snapshots as input and find which object or class of objects keeps growing in size over time.
- Find duplicate string instances. V8 does not always do string interning optimization, which means two JavaScript string primitives with the same value could be represented by two different native objects in V8’s heap.
Using MemLab at Meta: Case studies
Over the past few years, we’ve used MemLab to detect and diagnose memory leaks and have gathered insights that have helped us optimize memory, significantly improve memory and reliability (reducing OOM crashes), and improve user experience.
React Fiber node cleanup
For rendered components, React builds a Fiber tree — an inner data structure React uses for rendering the virtual DOM. Although the Fiber tree looks like a tree, it is a bidirectional graph that strongly connects all Fiber nodes, React component instances, and the associated HTML DOM elements. Ideally, React maintains references to the root of the component’s Fiber tree and keeps the Fiber tree from being garbage collected. When a component is unmounted, React breaks the connection between the host root of the component and the rest of the Fiber tree, which can then be garbage collected.
The downside of having a strongly connected graph is that if there is any outside reference pointing to any part of the graph, the whole graph cannot be garbage collected. For example, the following export statement caches React components at the module scope level, so the associated Fiber tree and detached DOM elements are never released.
export const Component = ((
  <List> ... </List>
): React.Element<typeof List>);
It’s also not just the React data structures that would be kept alive. Hooks and their closures can also keep alive all kinds of other objects. This means that a single React component leak could cause the leak of a significant part of a page’s objects, leading to huge memory leaks.
To prevent the cascading effect of memory leaks in the Fiber tree, we added a full traversal of a tree that does aggressive cleanup when a component is unmounted in React 18 (thanks to Benoit Girard and the React team). This allows the garbage collector to do a better job at cleaning up an unmounted tree. Any accidental memory leak is bounded to a smaller leak size. This fix reduced average memory usage on Facebook by almost 25 percent, and we saw large improvements across other sites using React when they upgraded. We were worried that this aggressive cleanup could slow down unmounting in React, but surprisingly, we saw a significant performance win because of memory reductions.
Relay string interning
By leveraging the heap analysis APIs in MemLab, we found that strings occupied 70 percent of the heap, and half of those strings had at least one duplicated instance. (V8 doesn’t always do string interning, which is an optimization that deduplicates string instances with the same value.)
When we further queried duplicated string patterns and clustering retainer traces we found that a significant portion of string memory is consumed by cached key strings in Relay. Relay generates cached keys for fragments by doing duplication, serialization, and concatenation. The string keys are further copied and concatenated for cached keys of other resources (e.g., fragments) in Relay. By collaborating with the Relay and React Apps teams, we optimized Relay cache key strings by interning and shortening overlong string keys on the client side.
This optimization enabled Relay to cache more data, allowing the site to show more content to users, especially when there is limited RAM on the client side. We observed a 20 percent reduction in memory p99 as well as OOM crashes, faster page rendering, improved user experience, and revenue wins.
Try MemLab today
We’re excited to open-source MemLab and have developers start using it. We are especially interested in seeing which use cases the community finds useful.
You can install MemLab through npm or build it from the GitHub repo:
npm i -g memlab
We also have a quick start guide to help developers get started.
If you’ve tried MemLab out on your own project, please reach out and let us know how it worked for you!
Acknowledgements
We’d like to thank Tulga Narmandakh and the rest of the Core Health Experience team for their contributions toward helping open-source MemLab.


