At Facebook we strive for our apps to be stable, fast, and reliable. We’ve worked hard to reduce the number of crashes in the Facebook iOS app and to increase its overall reliability. In the past, most of the crashes have been due to programmatic errors, and they always came with a stack trace that blamed the line in the code that caused the crash and always offered a hint as to what the issue might be.
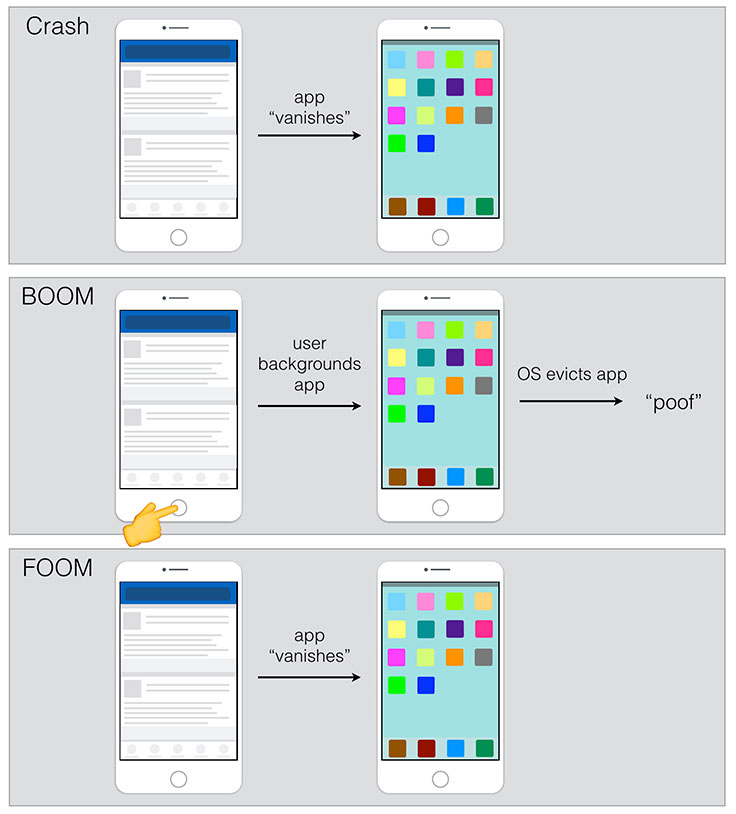
As we continued to fix crashes, we observed a drop in our measured crash rate but noticed in the App Store reviews that the community was continuing to surface frustration with the app crashing. We dug into the user reports and began to theorize that out-of-memory events (OOMs) might be happening. OOMs occur when the system runs low on memory and the OS kills the app to reclaim memory. It can happen whether the app is in the foreground or the background. We refer to these internally as FOOMs and BOOMs, respectively — it’s just a bit more fun to say that the app went BOOM!
From the user’s perspective, a foreground OOM crash (FOOM) is indistinguishable from a native crash. In both cases, the app unexpectedly terminates, appearing to vanish, and the user is taken back to the home screen of the device. If the rate of memory consumption increases drastically, the application can be killed without receiving any signal that memory is running out. On iOS, the OS does its best to send a memory warning to the app, but there is no guarantee that one will always be received before the OS evicts the process from memory. This leaves us with no easy way to know that the app was killed by the OS due to memory pressure.


Getting a handle on the problem
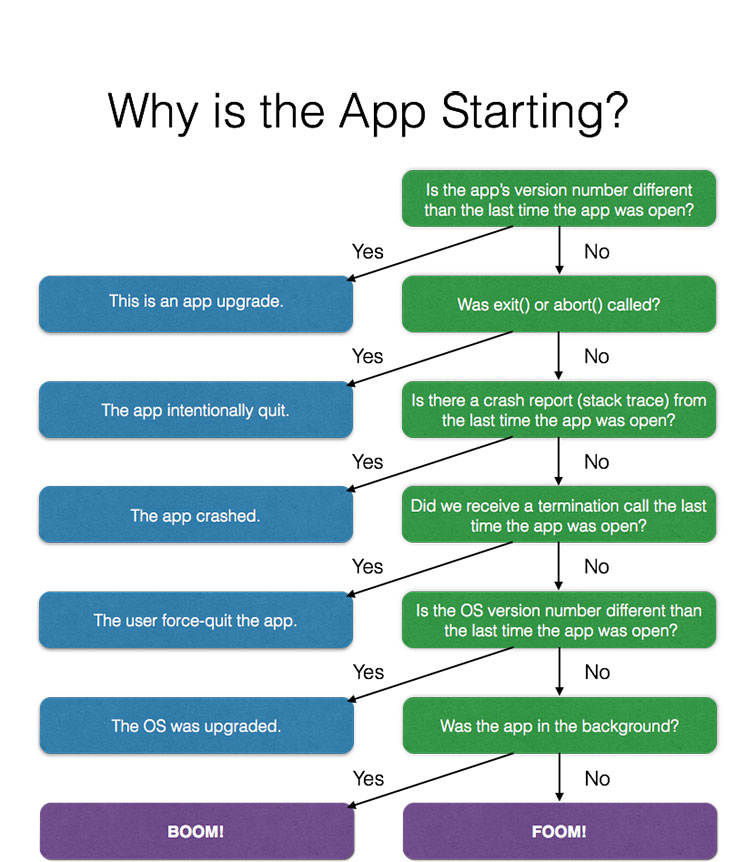
To get a handle on how often our app was being terminated due to OOM crashes, we started by enumerating all the known paths through which the application could be terminated and then logging them. The actual question we looked into was “What can cause the application to start up?”
The app could need to start up for the following reasons:
- The app was upgraded.
- The app called exit or abort.
- The app crashed.
- A user swiped up to force-exit the application.
- The device restarted (which includes an OS upgrade).
- The app ran out of memory (an OOM) in the background or the foreground.
By process of elimination, looking for instances that didn’t fall into the other cases, we could then figure out when an OOM had occurred. We also kept track of when the app backgrounded and foregrounded so that we could accurately break down OOMs into BOOMs and FOOMs, respectively.

The logging showed that there was a higher rate of OOMs on devices with less memory, which was expected and reassuring since the application process was more likely to be evicted on a constrained-memory device. Seeing the correlation in our logging helped us verify our process-of-elimination approach and continue to improve the logging (we didn’t actually identify all cases at first, such as app upgrades).
Our first effort to reduce the number of OOMs was to attempt to shrink the memory footprint of our app by proactively deallocating memory as quickly as we could, as soon as it was no longer needed. Unfortunately, we didn’t observe a real change in the number of OOM crashes, so we then shifted our focus to large allocations, starting with those that might be leaking (never cleaned up), especially via potential retain cycles.
Profiling memory usage
As we started fixing leaks, we saw some reduction in the OOM crash rate, but we still didn’t observe the significant reduction that we were hoping for. Next, we dived into the memory profiler in Apple’s Instruments application and noticed a repeated pattern of UIWebView allocating a lot of memory once the application opened any web page. We also found that the memory was often not reclaimed, even after the user navigated away from the page and the web view was closed.
We tried a number of optimizations, such as cleaning up the cache and clearing the content, but the memory footprint of our app’s process was always significantly increased after navigating to a web view. iOS 8 introduced a new class — WKWebView — that actually performs most of its work in a separate process, which means that most web-view-related memory usage would not be attributed to our process. In a low-memory event, the web view’s process could be killed and our app would be more likely to stay alive. After we migrated our app to WKWebView, we did indeed see a significant reduction of OOMs in our app. Yay!

Rate of allocation
While profiling for memory usage through Instruments, we also observed instances in the app usage where the application allocated a significant amount of memory (~30 MB) temporarily and then deallocated shortly thereafter. If the CPU was not idle during this allocation, there was a chance that the OS could kill the application. We were able to get rid of these temporary allocations, which helped reduce OOM crashes for certain scenarios by up to 30 percent. We also experimented and discovered that allocating once and holding on to memory was better for app reliability, rather than having repeat allocations and deallocations.
Prevention regressions
Even after migrating to WKWebView, we still found that a small memory leak could affect the OOM rate significantly, especially on the more memory-constrained devices. With our frequent release schedule and many teams contributing to the app, it was important to both catch and prevent memory leaks in the apps we release. We leveraged the CT-Scan infrastructure, originally designed to test for mobile performance, to log the amount of resident memory in the process, allowing CT-Scan to flag regressions as soon as they were introduced. This has helped us keep the OOM rate much lower than when we first started working on it.
An in-app memory profiler
The last key tactic we used in this project was to construct an in-app memory profiler, to allow profiling the app quickly by tracking all Objective-C object allocations. We configured this in CT-Scan and in the internal builds of our app.
Here’s how it works: For each class in the system, it keeps a running count of how many instances are currently alive. We can query it at any point and log the current number of objects for each class. We can then analyze this data for any abnormalities release-to-release to identify changes in the overall allocation patterns of our app, usually helping identify leaks when any count shifts drastically. We managed to implement this in a way that is performant enough that it doesn’t produce any noticeable impact in application performance to the user.
Here is a sketch of our strategy and how we tracked NSObject allocations.
We started by creating an allocation tracker class. It’s pretty straightforward and simply has a map of class names to instance counts with public methods for incrementing and decrementing the counts. We chose to use C++ rather than Objective-C so that we can keep any allocations and CPU overhead of our tracker to a minimum.
class AllocationTracker {
  static AllocationTracker* tracker();

  void incrementInstanceCountForClass(Class aCls);
  void decrementInstanceCountForClass(Class aCls);

  std::vector<std::pair<Class, unsigned long long>> countsSnapshot();

  ...
}
Then we use iOS method replacement (called “swizzling,” using the runtime function class_replaceMethod) to store the standard iOS methods +alloc and +dealloc in placeholder methods –fb_originalAlloc and –fb_originalDealloc.
Then we replace +alloc and +dealloc with our new implementations that increment and decrement that instance count on allocation and deallocation, respectively.
@implementation NSObject (AllocationTracker)

+ (id)fb_newAlloc
{
  id object = [self fb_originalAlloc];
  AllocationTracker::tracker()->incrementInstanceCountForClass([object class]);
  return object;
}

- (void)fb_newDealloc
{
  AllocationTracker::tracker()->decrementInstanceCountForClass([object class]);
  [self fb_originalDealloc];
}

@end
Then, while the app is running, we can call the snapshot method regularly to log the current number of instances alive.
App reliability matters
Once we rolled out the changes to resolve memory issues in the Facebook iOS app, we saw a significant decrease in (F)OOMs and in the number of user reports of the app crashing. OOM crashes were a blind spot for us because there is no formal system or API for observing the events and their frequency. No one likes it when an app suddenly closes. With some tooling, migration to the newest iOS technologies, and a bit of cleverness to measure the problem in the first place, we were able to make our app more reliable and ensure that it wouldn’t suddenly close while you were opening a web view to an interesting article — like this one!
Additional thanks to Linji Yang, Anoop Chaurasiya, Flynn Heiss, Parthiv Patel, Justin Pasqualini, Cloud Xu, Gautham Badrinathan, Ari Grant, and many others for helping reduce the FOOM rate.


