Thanks to some powerful new technologies, web applications have come a long way in the past decade. But the performance of these web applications still lags behind that of their native counterparts. Like many complex applications on the web, our desktop Facebook.com website is slower to load than our native mobile Android app on the same hardware — even though the web app loads an order of magnitude less code. We wanted to improve the startup time of web apps by improving the web platform, so we initiated several projects to help the web scale as a platform for large applications.
Facebook is deeply engaged with the web development community, standards bodies, and browser vendors so that we may learn from each other, share use cases and pain points, and contribute to web standards proposals and browser codebases. Over the past year, we have released several projects that directly address the browser ceiling on JavaScript code size and the gaps in web introspection APIs, including isInputPending, the JavaScript Self-Profiling API, and BinAST. At today’s Performance@Scale conference, we discussed several of these projects in more detail.
Web vs. native
In assessing this performance disparity between web apps and native apps, we saw that there were two main issues: Current browsers do not scale to large JavaScript codebases, and access to necessary system-level APIs is not available for building performant applications. Compared with machine code, JavaScript often suffers from parsing, compilation, and runtime just-in-time (JIT) optimization overheads. Additionally, loading JavaScript today usually means waiting for network round-trips on the critical path or waiting on browser HTTP caches that do not reliably scale to dozens of simultaneous resource requests at the start of a page load. In contrast, once installed, native applications update in the background and have well-honed OS machinery to support fast startups.
In addition, web APIs are generally higher-level and less powerful than native APIs. For example, there is not yet a standard web API for a web app to query its own memory use. Nor is there currently a way for a browser to discover that the application events scheduled in the browser execution queue have changed priority. Native operating systems expose richer APIs and lower-level primitives, giving developers the tools to fill any gaps themselves.
Evolving the web platform
The following projects directly address the browser ceiling on JavaScript code size and the gaps in web introspection APIs:
Better scheduling with isInputPending()
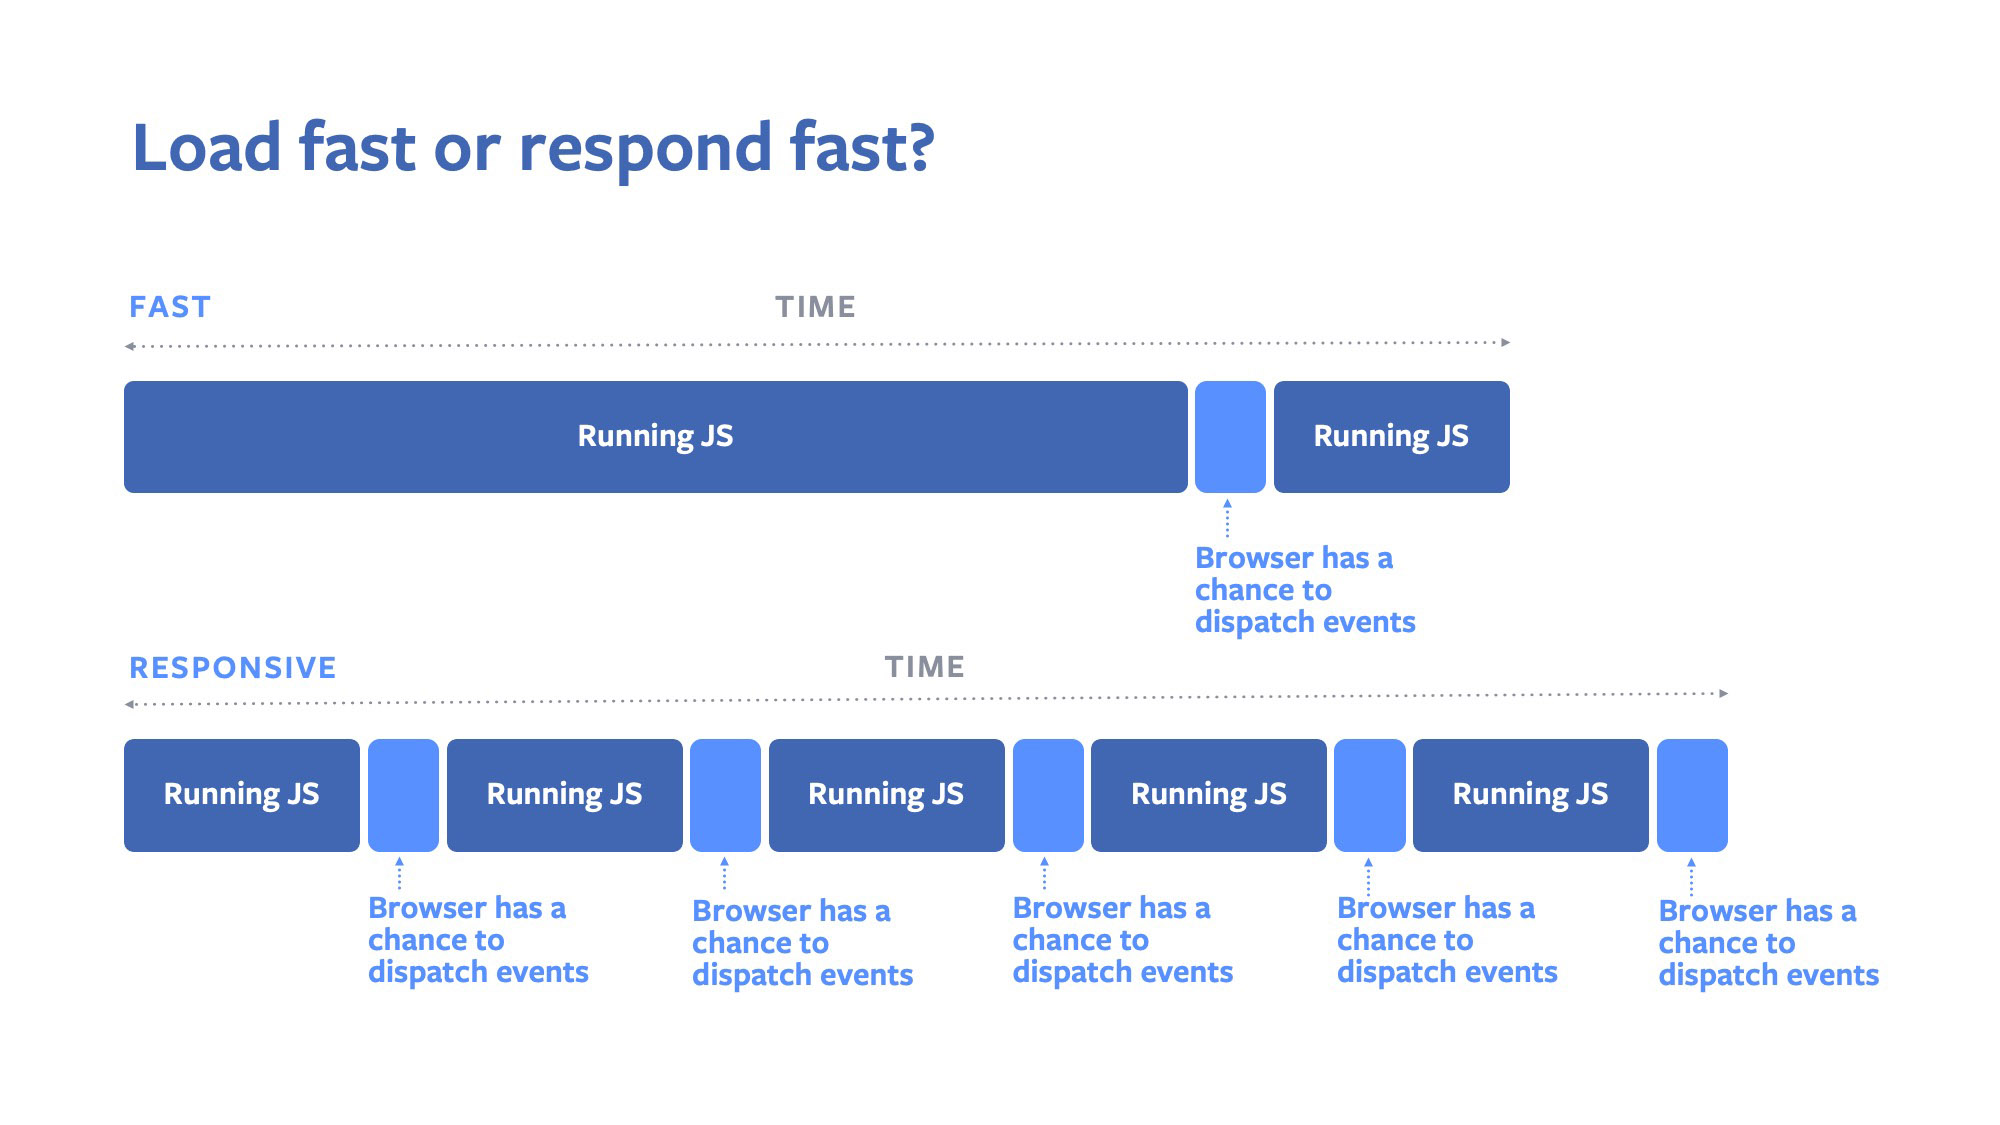
Since the web relies on a single non-preemptible thread for most rendering, JavaScript execution, and input handling, it is important to efficiently schedule work on this thread. For an app to remain responsive, input-handling code must have a chance to run shortly after the user interacts with the application. In the browser’s cooperative multitasking environment, this means that noncritical events should yield the event loop whenever the user tries to interact with the app.
Today, there is no way for a running JavaScript task to know whether a user input event is pending and whether the task needs to relinquish control of the event loop. Also, it would not be ideal for events to blindly limit their own execution durations, because this would add an unnecessary overhead of switching contexts and degrade throughput.

To address this shortcoming, we proposed a specification for an isInputPending() API that would allow JavaScript code to efficiently check whether a user input is currently waiting to be handled, thus allowing lower-priority JavaScript code to efficiently relinquish control of the event loop only at the right moments.
We implemented this API in Chrome and tested it in a Chrome Origin Trial on Facebook.com (with other websites simultaneously conducting their own trials). The preliminary results on Facebook.com are encouraging, showing significant improvements in response times to user inputs. If adopted into standard, this API will be particularly beneficial to JavaScript frameworks like React and Angular that spend a significant amount of execution time rendering UIs in response to data changes. The isInputPending() API was our first browser API contribution.
Read more about isInputPending().
Better web benchmarking
It is challenging to detect small regressions in website load times in controlled environments, in part because the OS, the browser, and often the site itself introduce subtle nondeterminism and sources of noise between test iterations. Furthermore, when a performance regression is detected by the performance testing automation, developers may not be able to reproduce it on their own machines to debug it because of differences in hardware and environments.
We found retired instruction counts (a metric exposed by CPUs) to be more reproducible across environments, and more sensitive and less noisy than wall clock timings or CPU timings. We found an order of magnitude reduction in noise after switching from CPU timings to retired instruction counts. At the same time, this new metric allowed developers to reproduce the performance testing results on their own machines. Even in stress testing, we found that retired instruction counts remained consistent despite hundreds of threads on the testing system hammering the CPU and input/output. To extend this functionality more widely into performance test infrastructure, we added retired instruction counts to the Chrome performance tracing system, accessible via chrome://tracing.
Self-profiling API for JavaScript
Facebook.com is a codebase containing millions of lines of code, and this code runs on a variety of devices and environments used by people who each have their own unique combination of hardware, configurations, data, and usage patterns. As a result, it is impossible for a developer to predict ahead of time which JavaScript execution path in the codebase may become a performance bottleneck for users. We designed and proposed a native JavaScript Self-Profiling API to collect accurate JavaScript execution stack traces with low CPU overhead and no code changes required. We implemented this functionality in Chromium, and we are now working toward a Chrome Origin Trial.
If the field trials are successful and this proposal gains the approval of web standards bodies, we hope that this API will significantly lower the difficulty of building performant web apps. Lab testing can only mirror a subset of real-world problems. By collecting data from the field, sites can identify the sources of hangs, slow responses, and high energy usage with ease. By monitoring changes, sites can identify and fix regressions shortly after they’re shipped. In particular, we hope third-party web performance analytics companies will leverage this API in their offerings so websites of all sizes can optimize their code without needing to build complicated tooling.
Parser-friendly binary encoding of JavaScript with BinAST
As mentioned earlier, JavaScript has additional overheads compared with machine code, including parsing, compiling, and optimization and deoptimization by the JIT compiler. Currently, the only alternatives to JavaScript on the web are asm.js and WebAssembly, but most websites are written in JavaScript and would need to be rewritten to take advantage of these technologies. We needed a way to improve JavaScript startup performance while maintaining compatibility with existing codebases.
We quickly discovered that a significant amount of browser CPU time during page load is spent parsing JavaScript (roughly 750 ms of CPU time on an i5 Ultrabook is spent parsing Facebook.com JavaScript). In our observations, only about half the JavaScript functions received by the browser are actually executed during a page load, so parsing all JavaScript functions is unnecessary. Note that different subsets of code are executed by different users and across different page loads, so the unexecuted code is not dead code. Unfortunately, JavaScript engines need to parse entire files in order to check for syntax errors, find function boundaries, identify which variables are closed over for smarter memory allocation strategies, and so on.
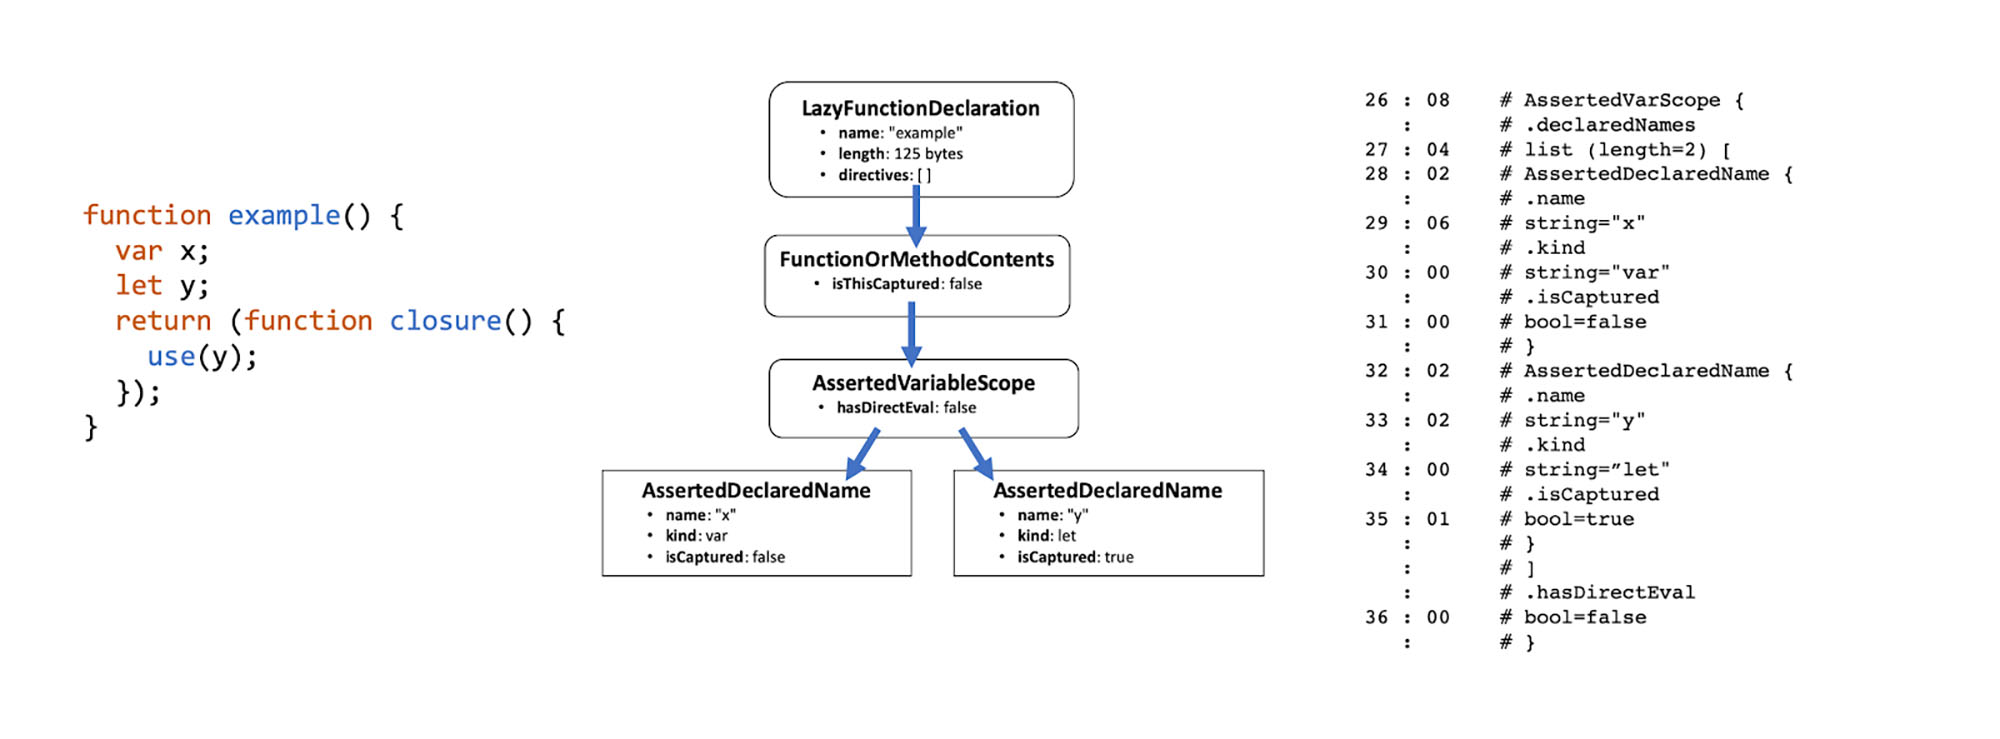
To address this parsing issue, we partnered with Mozilla to propose an experimental BinAST binary encoding format for JavaScript to allow engines to parse only the code they plan to execute. BinAST is a binary encoding of JavaScript’s abstract syntax tree (AST), with a few extra annotations on functions to allow JavaScript engines to selectively parse functions of interest and skip over other functions. These function annotations include the length of the function’s body for fast seeking, lists of declared names in a scope, lists of closed over variables, and whether eval is used in the function body. This is information that a JavaScript engine normally obtains by parsing all function bodies.
 The new format has deferred file correctness errors, since syntax errors do not exist in a machine-generated format. It does not require a verification step before execution. The AST is based on the Shift AST; the ECMA-262 format is too verbose and would bloat file size. BinAST is compatible with all existing JavaScript and can be simply dropped in as an additional build step to an existing JavaScript build pipeline.
In partnership with Mozilla, we implemented experimental BinAST support in Firefox Nightly. We found significant parsing throughput wins in microbenchmarks, with the win predictably scaling with the proportion of unused functions in the encoded file. We expect the CPU and energy savings to be particularly beneficial to lower-end and mobile devices. We are currently working on end-to-end performance benchmarking, as well as on bringing the file format size to parity without having to rely on external dictionary files. Our BinAST experiments are open source, and we are very open to new partners and contributors. CloudFlare developers documented their own findings from trying BinAST.
We believe there is an opportunity to increase the performance and richness of the web platform. Collaborations among web properties, web developers, standards experts, and browser vendors are necessary to generate new ideas to help bridge the gap between the web of today and the future of nativelike performance on the web. We look forward to working with new partners to continue making the web platform faster and more efficient for everyone.


