
Optimizing performance for internet applications can involve some intricate trade-offs. Sending too much data too quickly could incur retransmissions due to loss, which could hurt performance over time. But sending it too slowly could cause latency and stalls, which also hurt performance. In addition, different video experiences require different trade-offs for quality vs. latency. For an interactive experience, an application might be able to let quality dip a bit in favor of avoiding stalls. But when high-quality video is the most important factor, the application might comfortably incur more queueing delays. Applications generally select from among several different congestion control algorithms to find the right one to optimize for the goal at hand. We needed a single tunable congestion control algorithm that could serve a varying set of application needs.
Although there is a large body of research around congestion control, putting the research into practice has historically involved modifying the Linux kernel. With QUIC, the entire transport stack can be implemented in userspace without modifying the kernel, which makes deployments and experimentation far easier. Coupling COPA with QUIC gives us an algorithm that could work for a variety of video experiences and a deployment strategy that we can reasonably follow. In testing, COPA outperforms two popular algorithms, CUBIC and BBR v1. In this post, we’ll share the work we’ve done to facilitate this type of experimentation and our learnings from evaluating COPA at scale.
Testing COPA: A delay-based congestion control
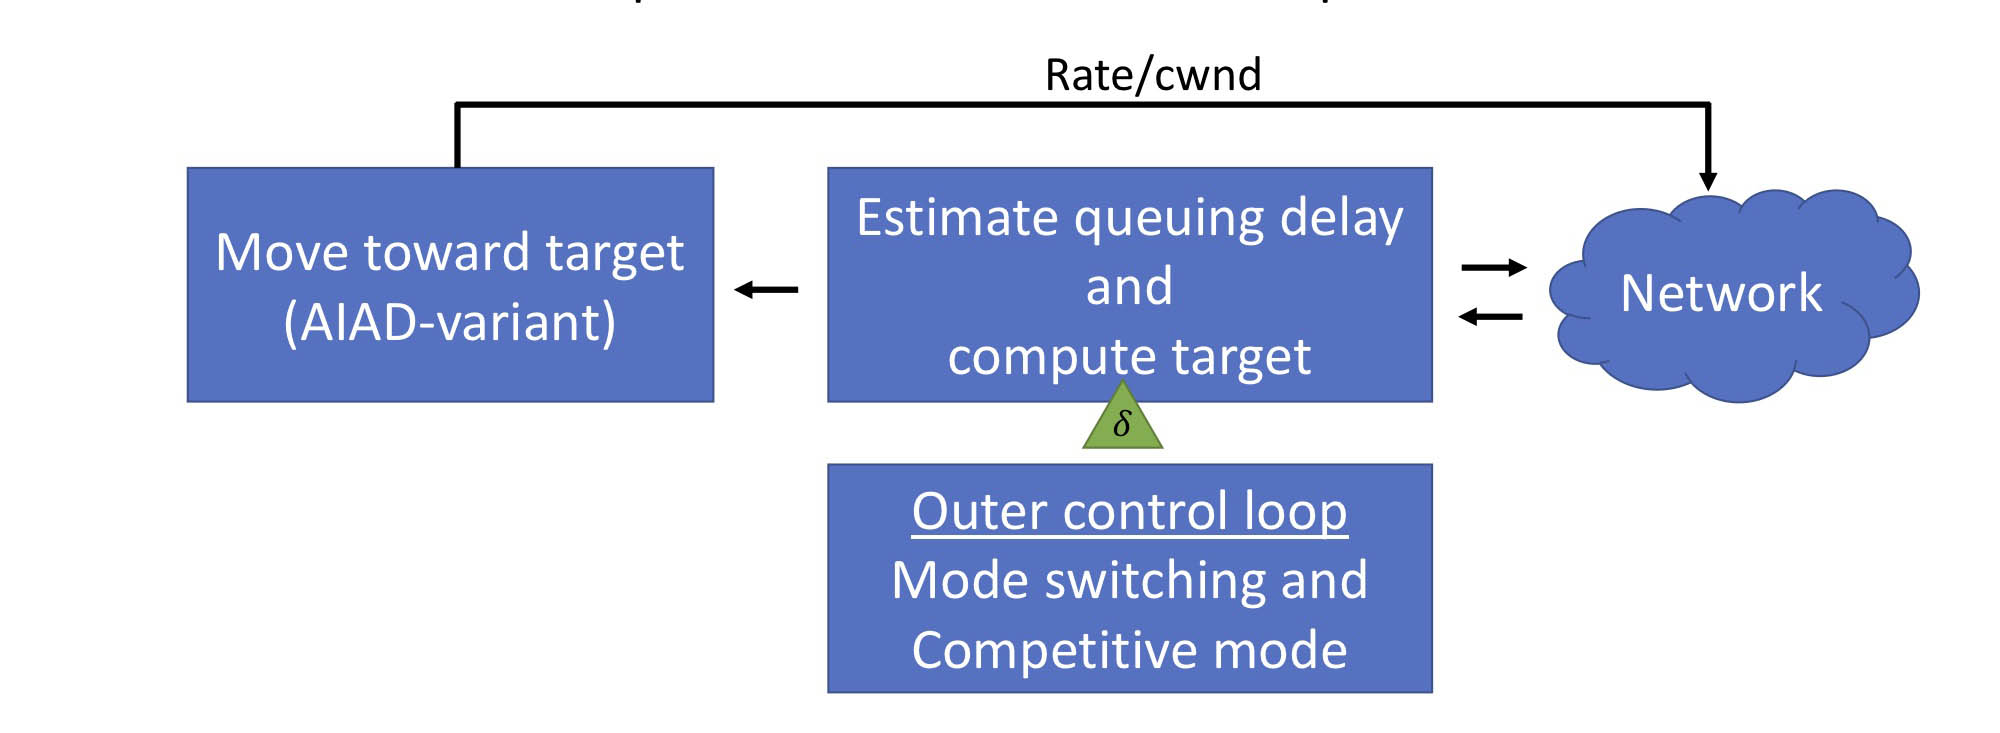
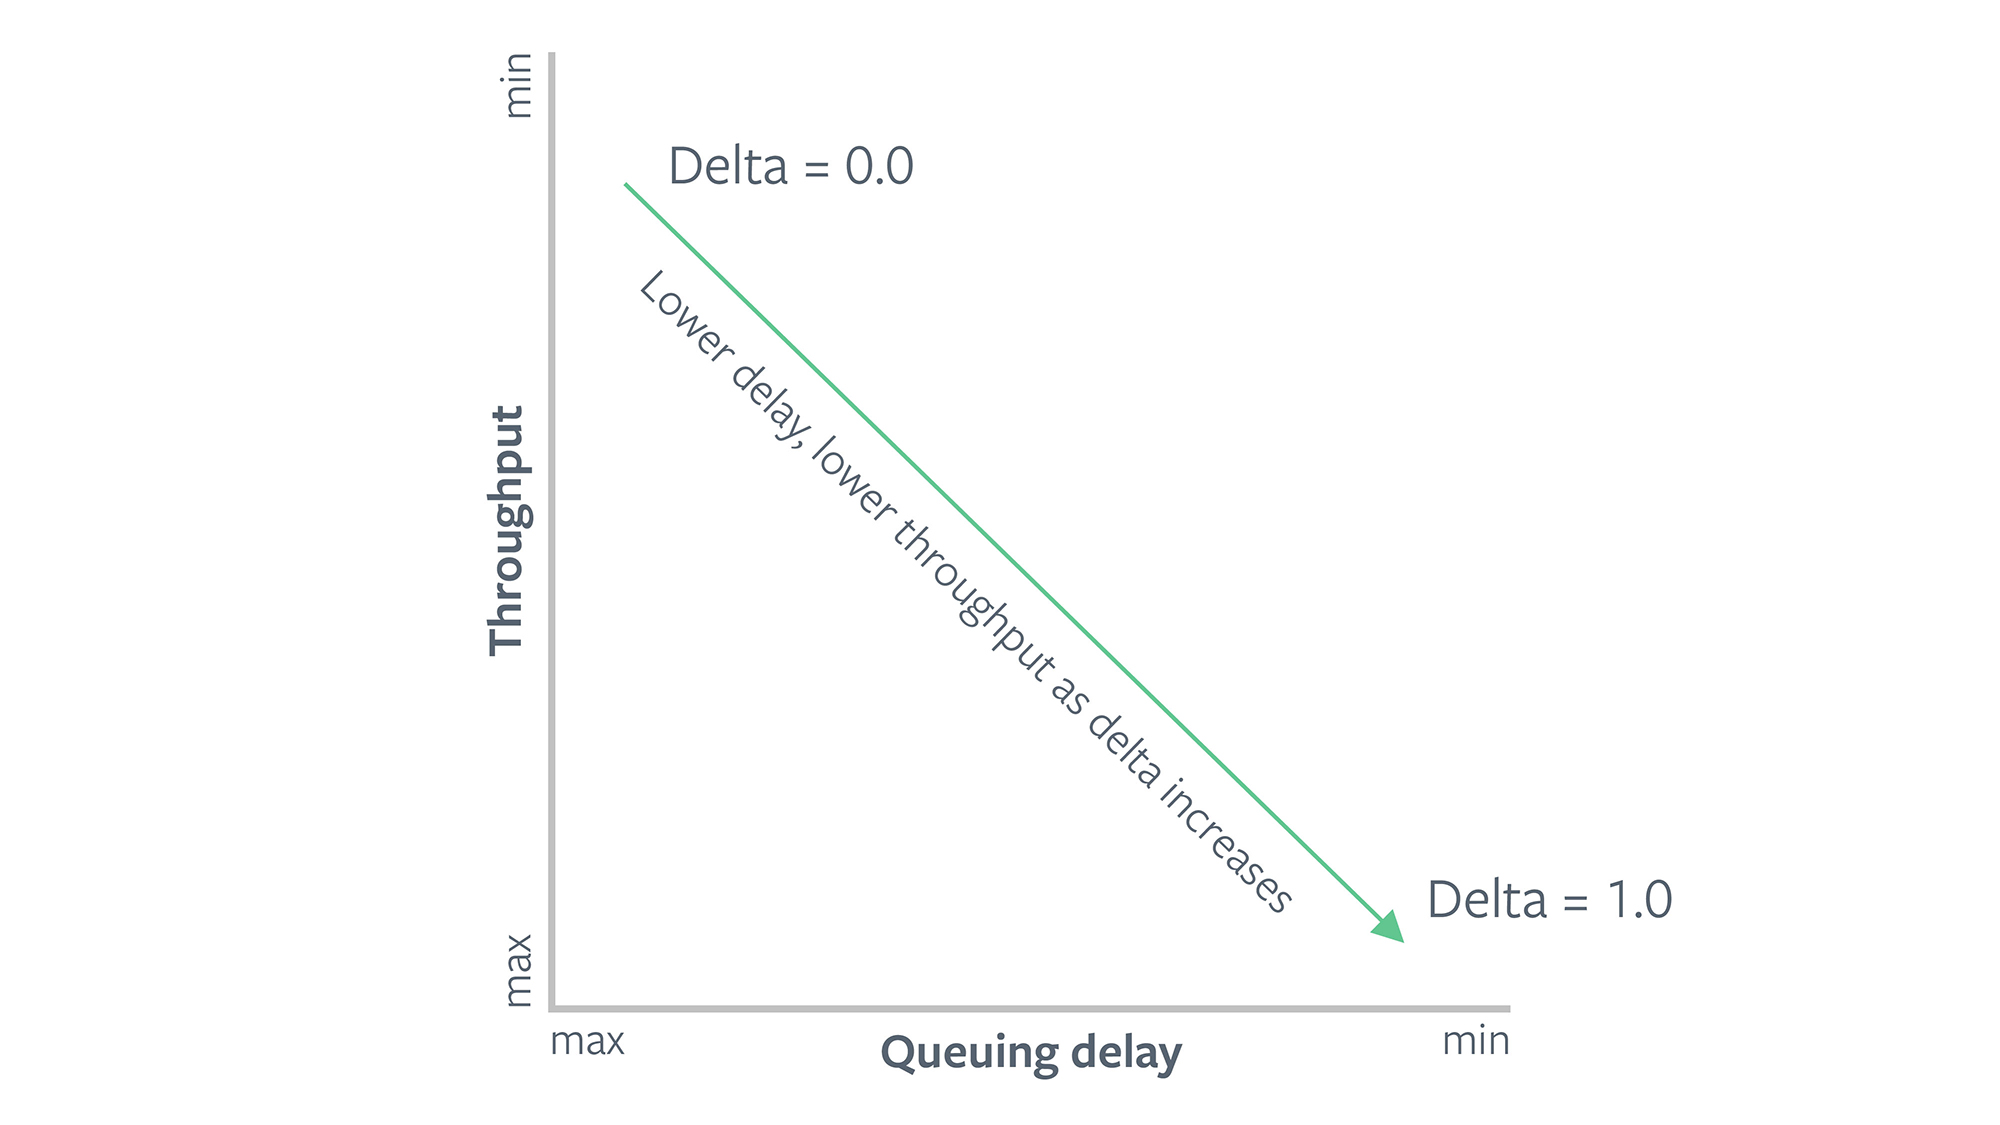
We implemented and evaluated COPA, which is a tunable delay-based congestion control algorithm designed at MIT. COPA is based on an objective function where the trade-off between throughput and delay can be configured via a user-specified parameter, delta. A higher value of delta makes COPA more sensitive to delays and provides lower throughput. A lower value of delta will provide more goodput at the cost of incurring more delays.
For experimentation, we chose Facebook Live on Android platform. With this product, a person is able to stream video that can be watched live by their friends and followers. In this setup, a phone camera produces video; an adaptive bit rate algorithm measures the application goodput and adjusts the encoding bit rate; and we then use QUIC to transport the video to FB servers, where it is reencoded and served to the people watching it.
In our first test, we implemented COPA without competitive mode (i.e., using a fixed delta value). We used a delta value of 0.04 to generate the results below, which we found to provide a reasonable quality vs. latency trade-off for the application, and compared it with both CUBIC and BBR v1 congestion control algorithms. CUBIC, which is widely used and is Linux’s default congestion control algorithm, works by increasing CWND until there is packet loss and then backs off by multiplicatively reducing the CWND. But it has some known issues, such as bufferbloat, which incurs latency, as well as the jagged, sawtooth-like pattern of transmission that it provides. BBR is a newer algorithm developed by Google that builds a model of the network path using bottleneck bandwidth and RTT, and adjusts sending rate to achieve an optimal point between bandwidth and delay. All three implementations (COPA, CUBIC, and BBR) can be found here in our QUIC implementation.
Results
We ran A/B tests to measure the performance of Facebook Live videos from all over the world, with the majority of sessions coming from the U.S., Mexico, India, Indonesia, Vietnam, and Thailand. In our experiments, we focused on the following application metrics for each video:
- Average goodput: Total application bytes sent during broadcast divided by duration. Please note that Facebook Live sessions are long (from tens of seconds to several minutes), and the application is changing bit rate in response to observed goodput and queue sizes. The better the goodput, the better quality we are able to deliver. When retransmissions happen, these bytes don’t increase goodput, because they don’t represent any new application bytes — in fact, this reduces goodput.
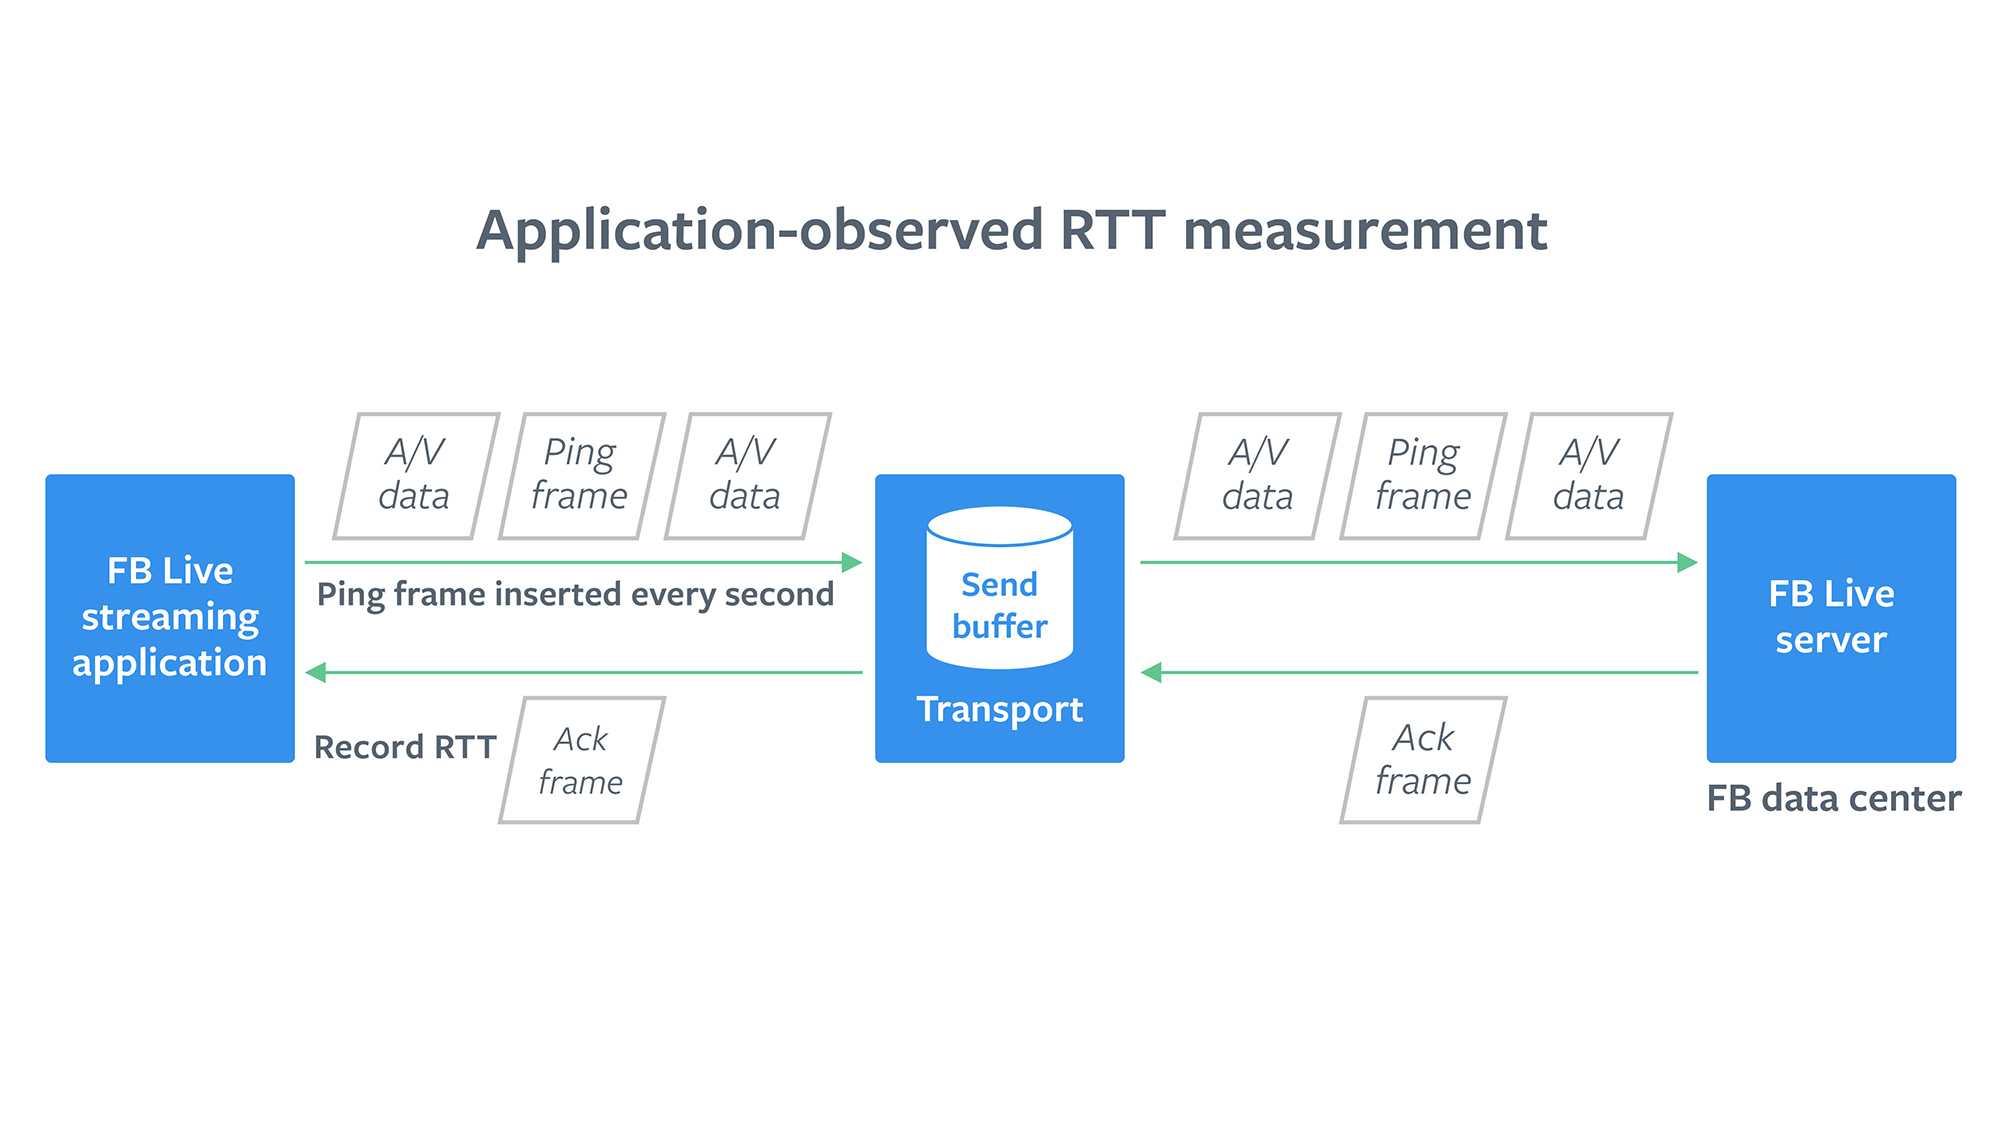
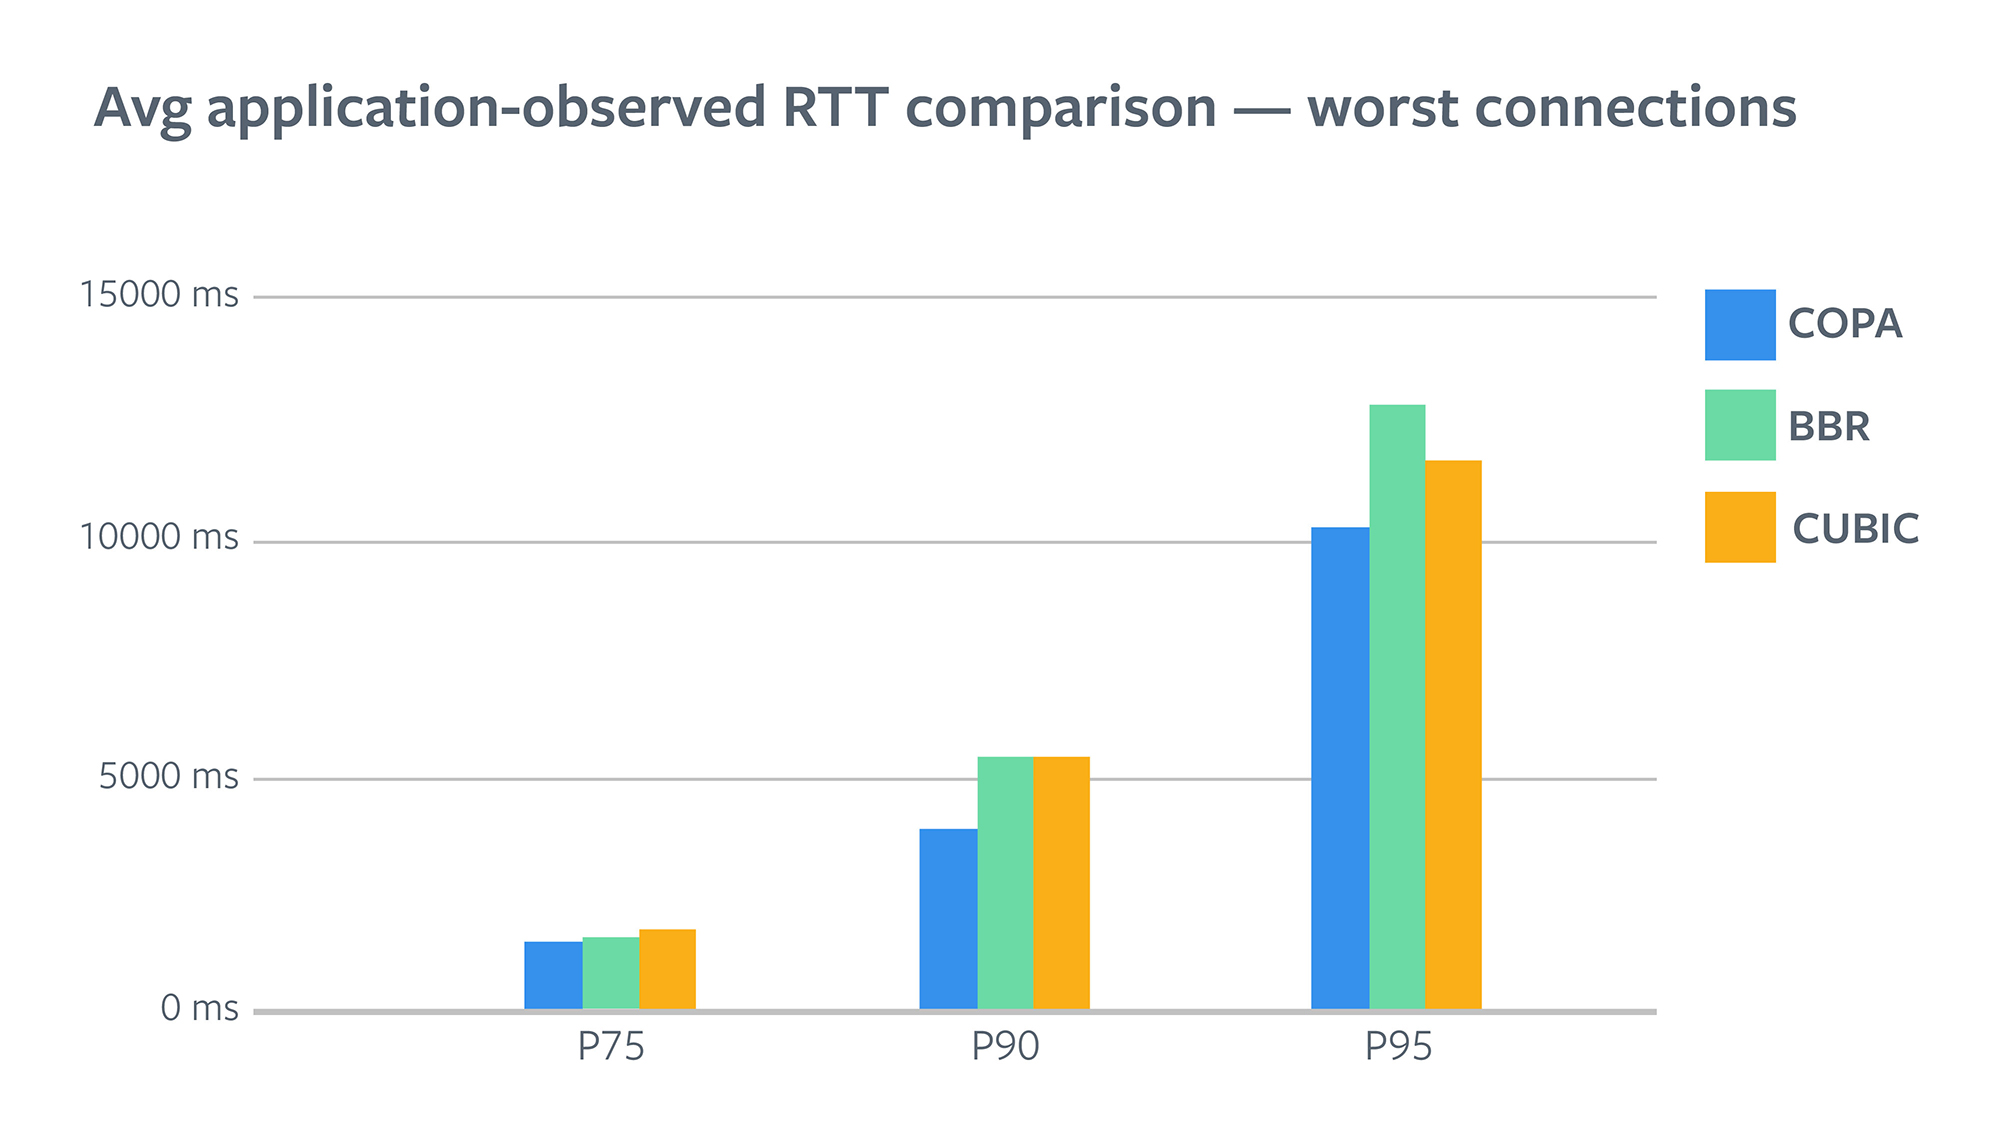
- Average application observed RTT: This is a proxy for Live ingest latency. Every second, the application sends a small dummy payload to the server and waits for an acknowledgement. We measure this round-trip time (RTT) and take the average over the session to calculate average app RTT. If bit rate is the same or higher, lower app RTT means lower video ingest latency.
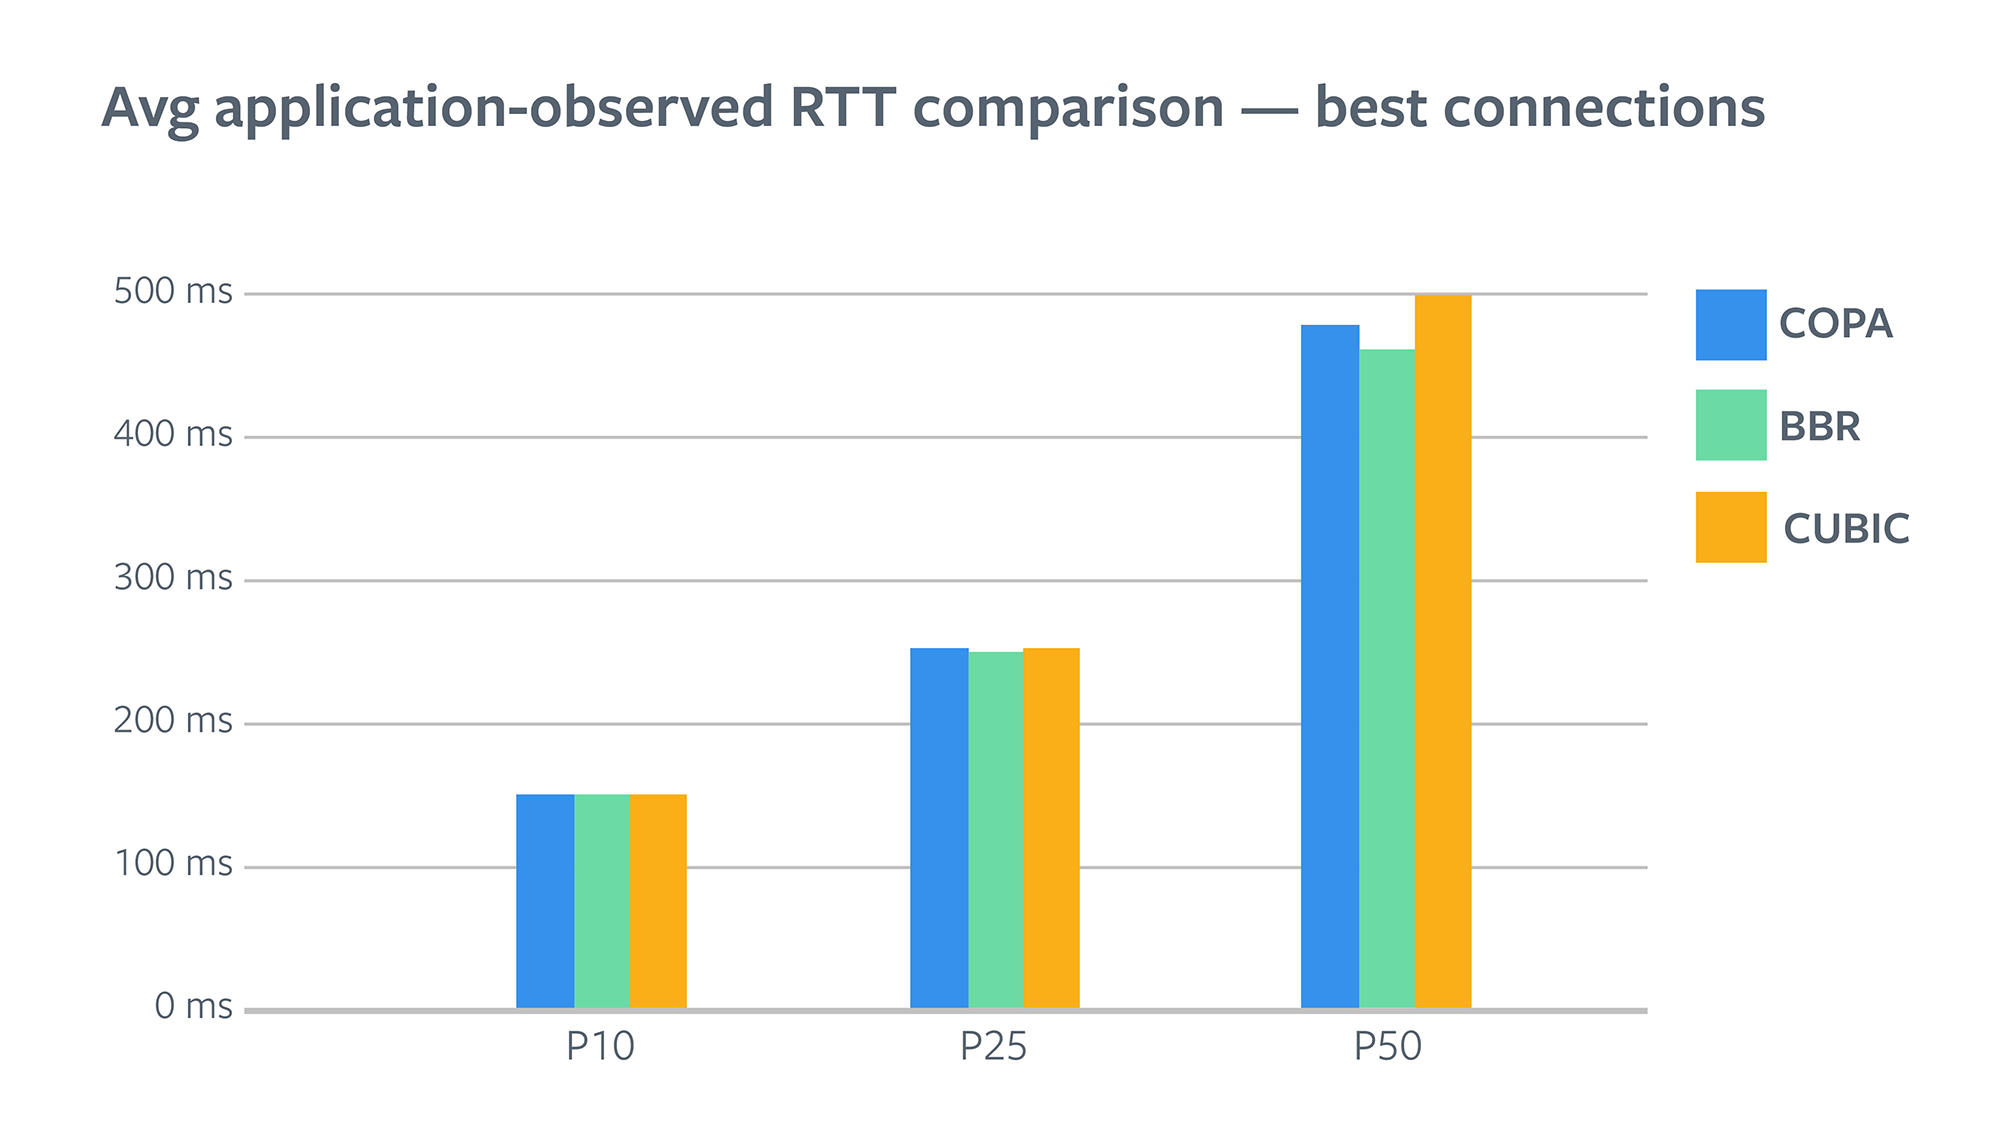
In our tests, we found that COPA consistently provided lower video latency as measured with the application-observed RTT than CUBIC. For sessions with a seemingly good network and already low latencies, BBR offered greater reduction than COPA. P50 App RTT was down from 499 ms for CUBIC to 479 ms for COPA and 462 ms for BBR, a 4 percent reduction with COPA and an 8 percent reduction with BBR.
However, for sessions with a worse network and higher latencies, COPA lowered them much more. P90 App RTT was down from 5.4 sec for CUBIC to 3.9 sec for COPA, a 27 percent reduction with COPA, whereas BBR reductions started diminishing.
In most real-world scenarios, we can reduce latency by trading off some quality. If we reduce video bit rate, i.e., reduce quality, and write less on the wire, it will naturally result in lower video latencies when there are network bottlenecks. When comparing the goodput numbers for the three groups, we found that COPA and BBR provided significantly better goodput than CUBIC. This means that COPA and BBR not only reduced latency for the application but also allowed the application to deliver better-quality video. This improvement was large enough to change how much people watched videos as a whole. Following the pattern of improvements in latency, COPA improved goodput more than BBR did. BBR improved P10 goodput by 4.8 percent, whereas COPA improved it by 6.2 percent. BBR improved P50 goodput by 5.5 percent, whereas COPA improved it by 16.3 percent.
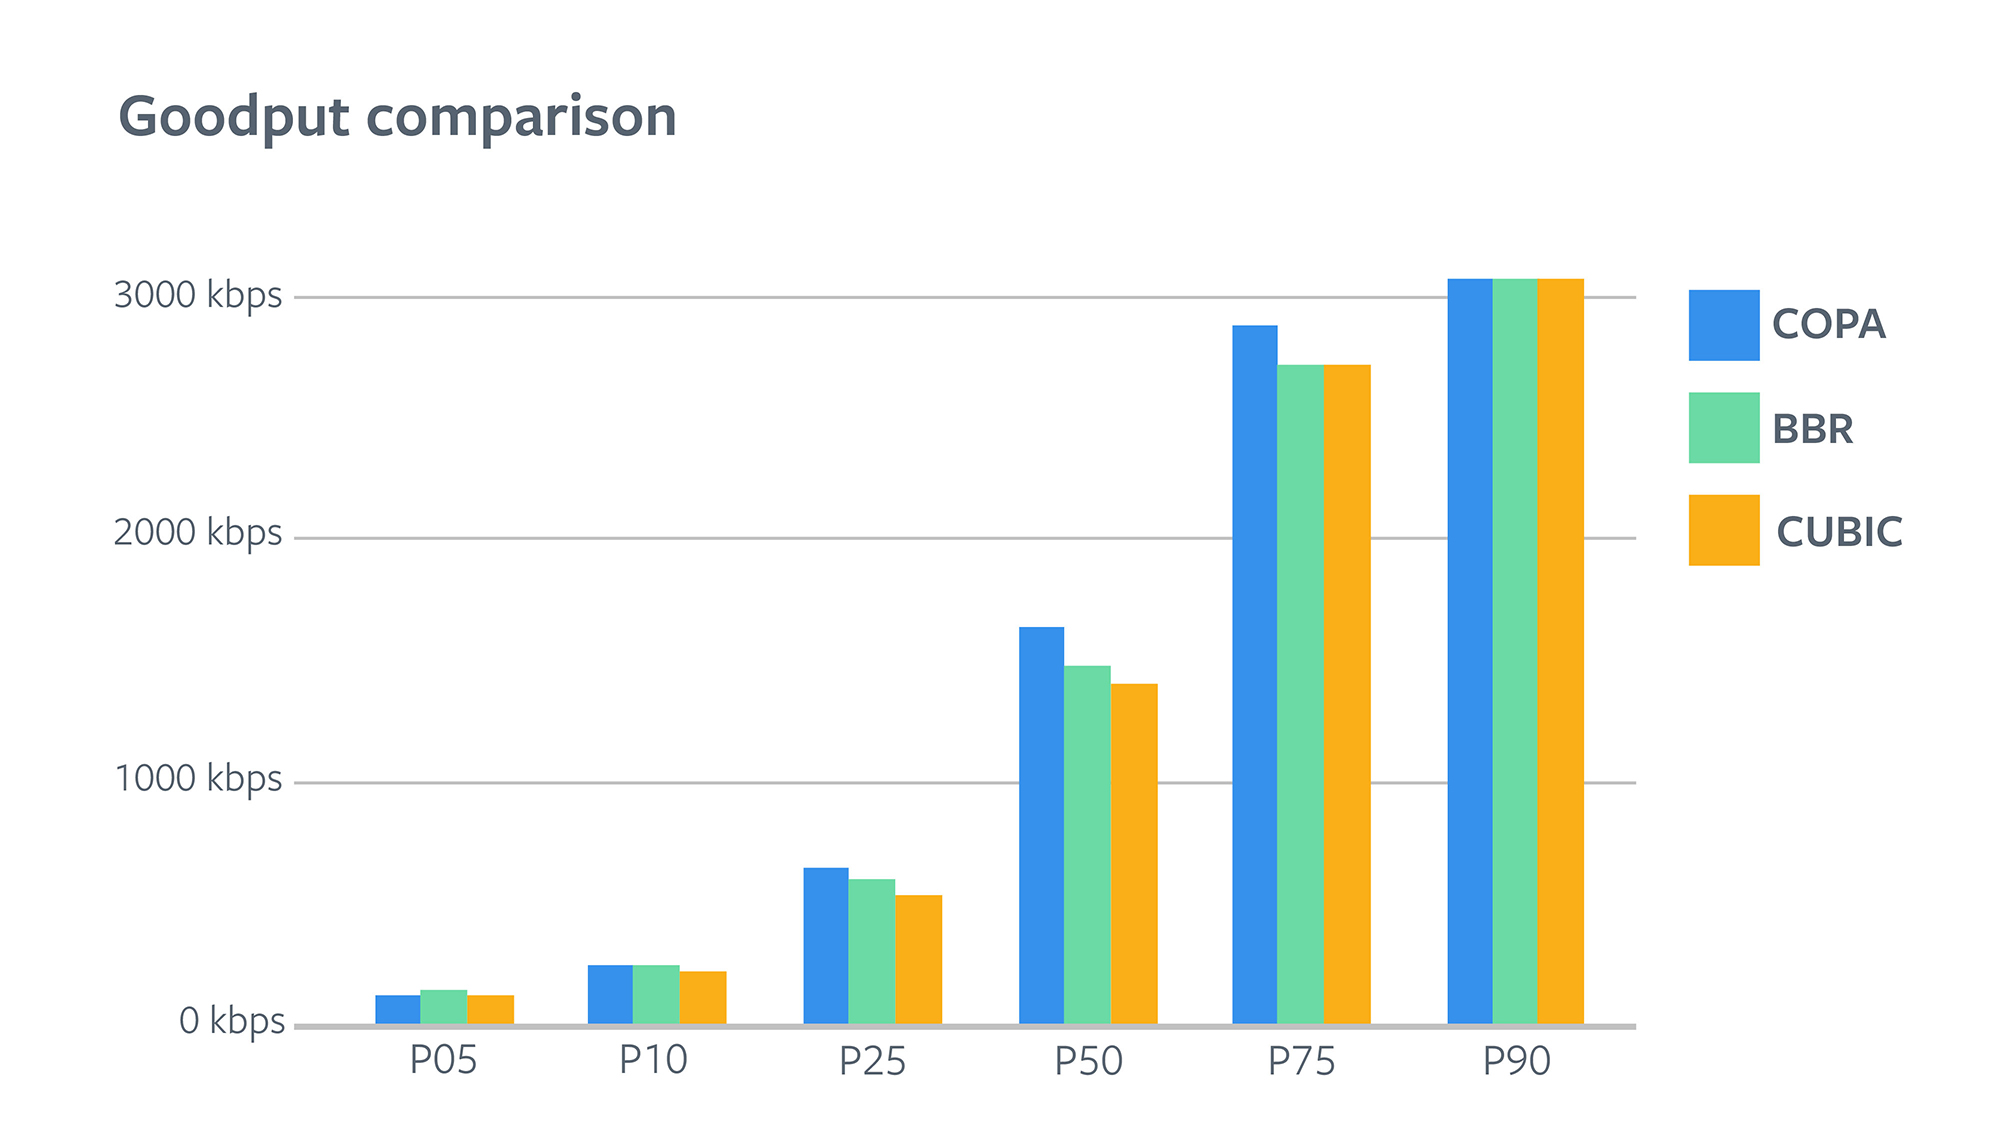
Note that the gains seem to diminish for P90 and above, but that was because the encoder bit rate was capped at 3 Mbps for this experiment. To understand where these gains came from, let’s look at some lower-level metrics. Within the transport implementation, we focused on measuring the QUIC transport’s RTT and retransmission overhead. Note that the transport RTT and application RTT are very different — the former would measure the round-trip time of a packet after writing it over the wire, whereas the latter would measure it after it leaves the application layer. The application RTT also hides retransmissions, i.e., in case of a packet loss, it will comprise several round-trips at the transport layer.
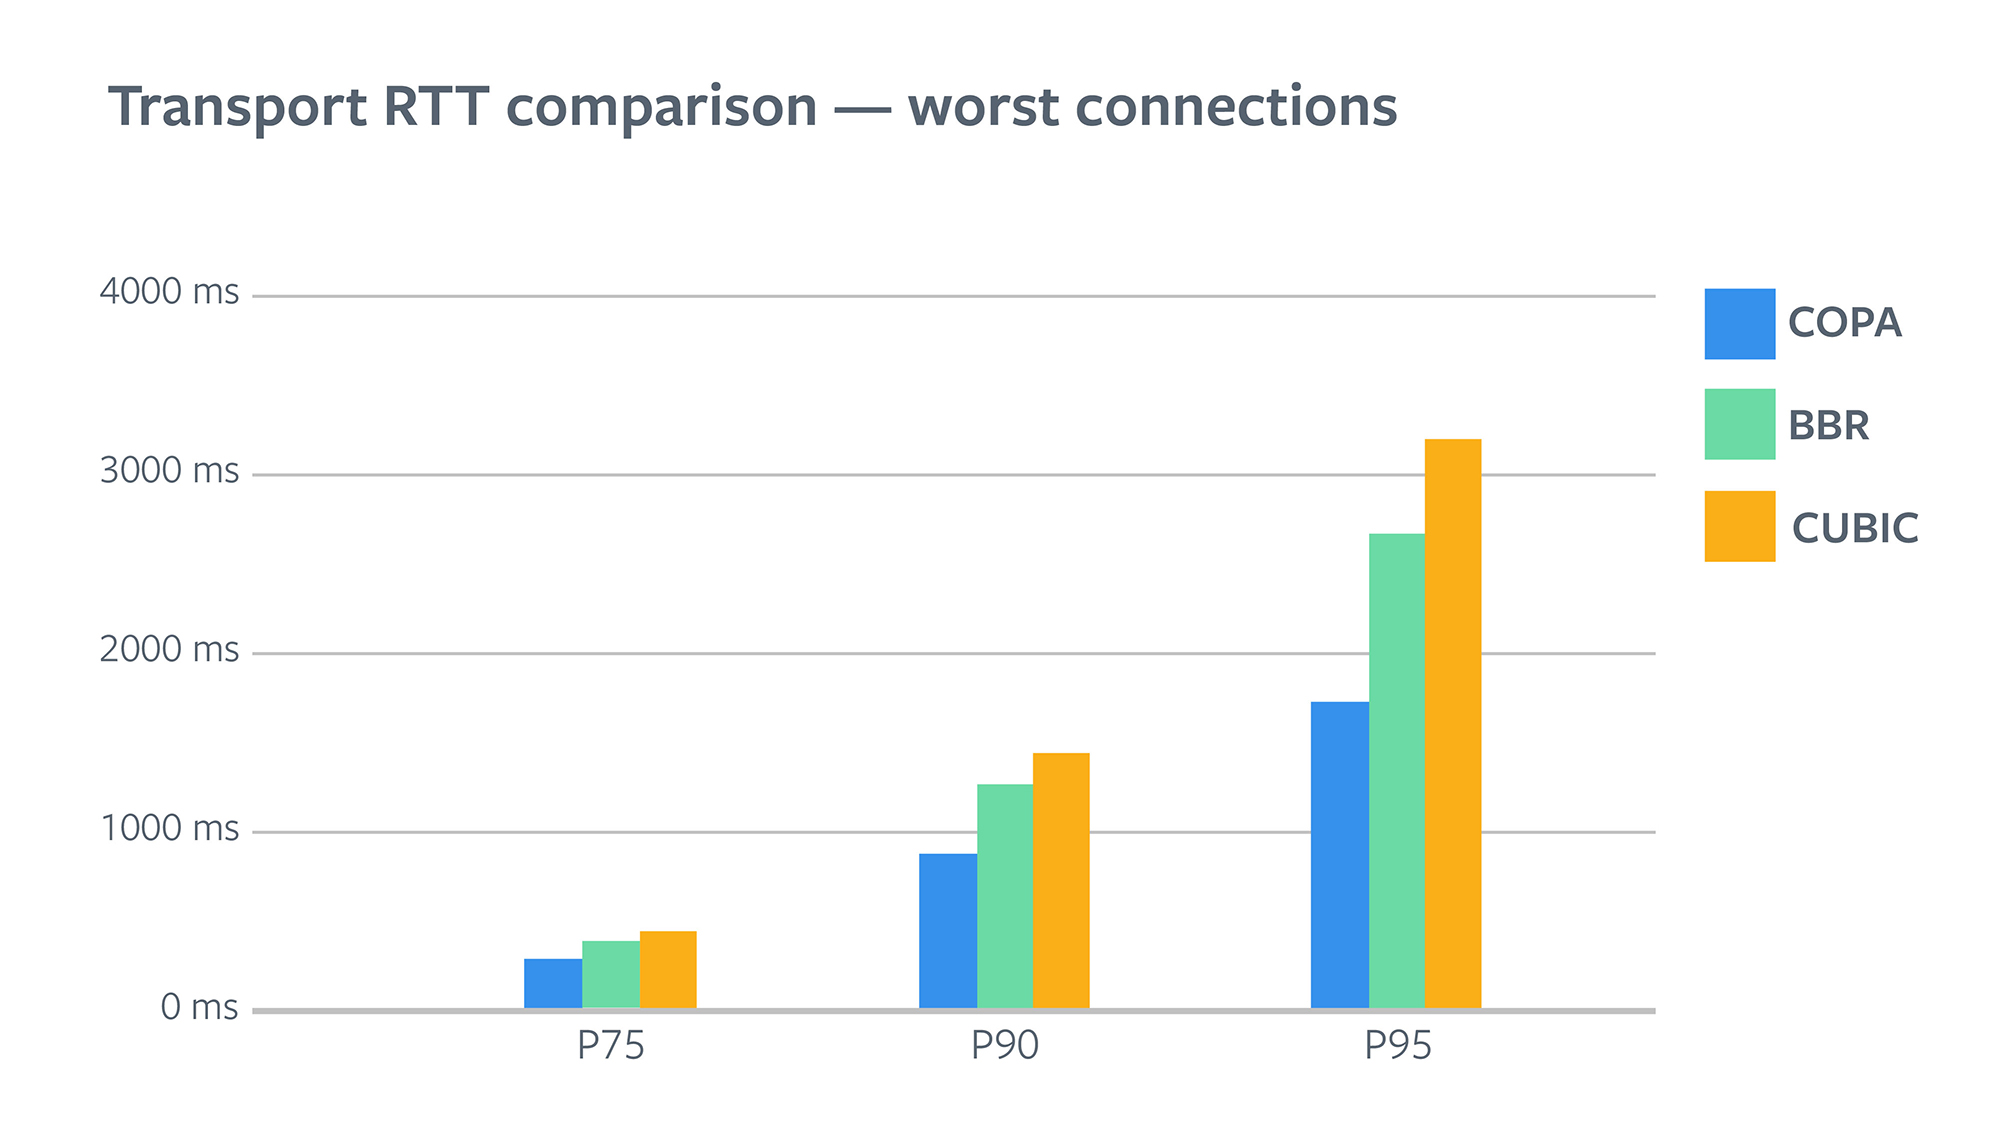
Average transport RTT comparison
Following the pattern of improvements in application RTT, BBR offered us lowest transport RTTs for best connections (P25 and below). But the reduction wasn’t big, because the RTTs were already very low for those users.
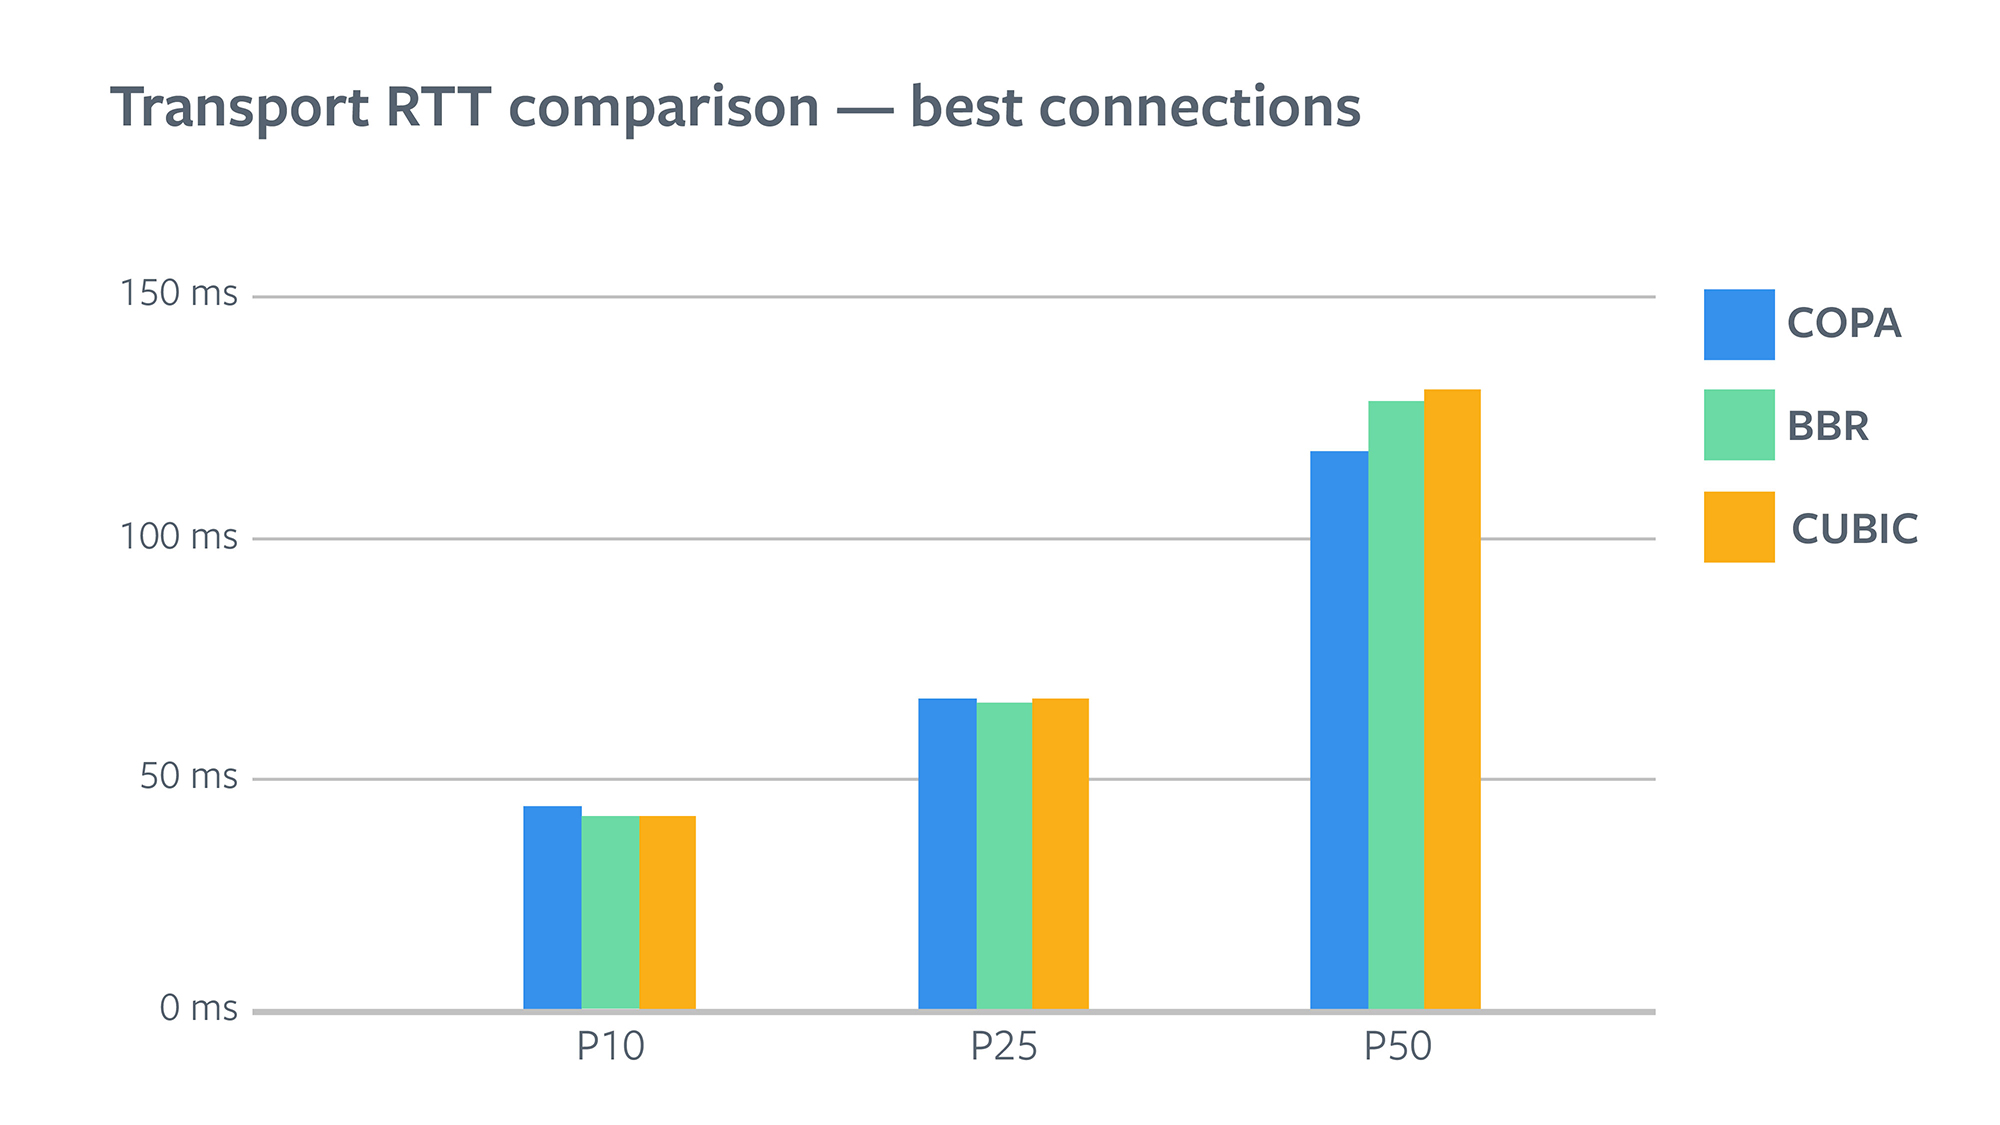
When you look at P75 and above, it is clear that COPA provided the lowest values here. BBR reduced P75 RTT by 10 percent, whereas COPA reduced it by 35 percent. The reduction in P95 is even greater: BBR reduced it by 16 percent, whereas COPA reduced it by a whopping 45 percent.
Lower transport RTT explains some of the video latency reductions we saw. It’s worth noting that video latency (application RTT) also depends on how much data the application is sending based on ABR, which affects how much data is queued in the transport send buffer. It’s therefore possible that improved transport allowed the ABR to produce better quality, which offset some of the latency reduction from lower transport RTT. On the other hand, variation in transport RTT depends only on how much data is queued in the underlying network after the packet leaves the transport.
RTX overhead comparison
To gain more understanding of transport behavior, we looked at how much data is being lost and retransmitted. The exact definition of this metric is:
RTX Overhead = Total bytes retransmitted by transport / Total bytes ACKed
We found that between BBR and CUBIC, BBR has lower overhead overall for all users. It’s around half that of CUBIC for around 90 percent of users. Between COPA and CUBIC, overhead varies quite a lot. COPA has one-fourth of the overhead for around 75 percent of users. As you go in tail cases, it starts to climb up and surpasses CUBIC to become 4-5 times as much for tail cases.
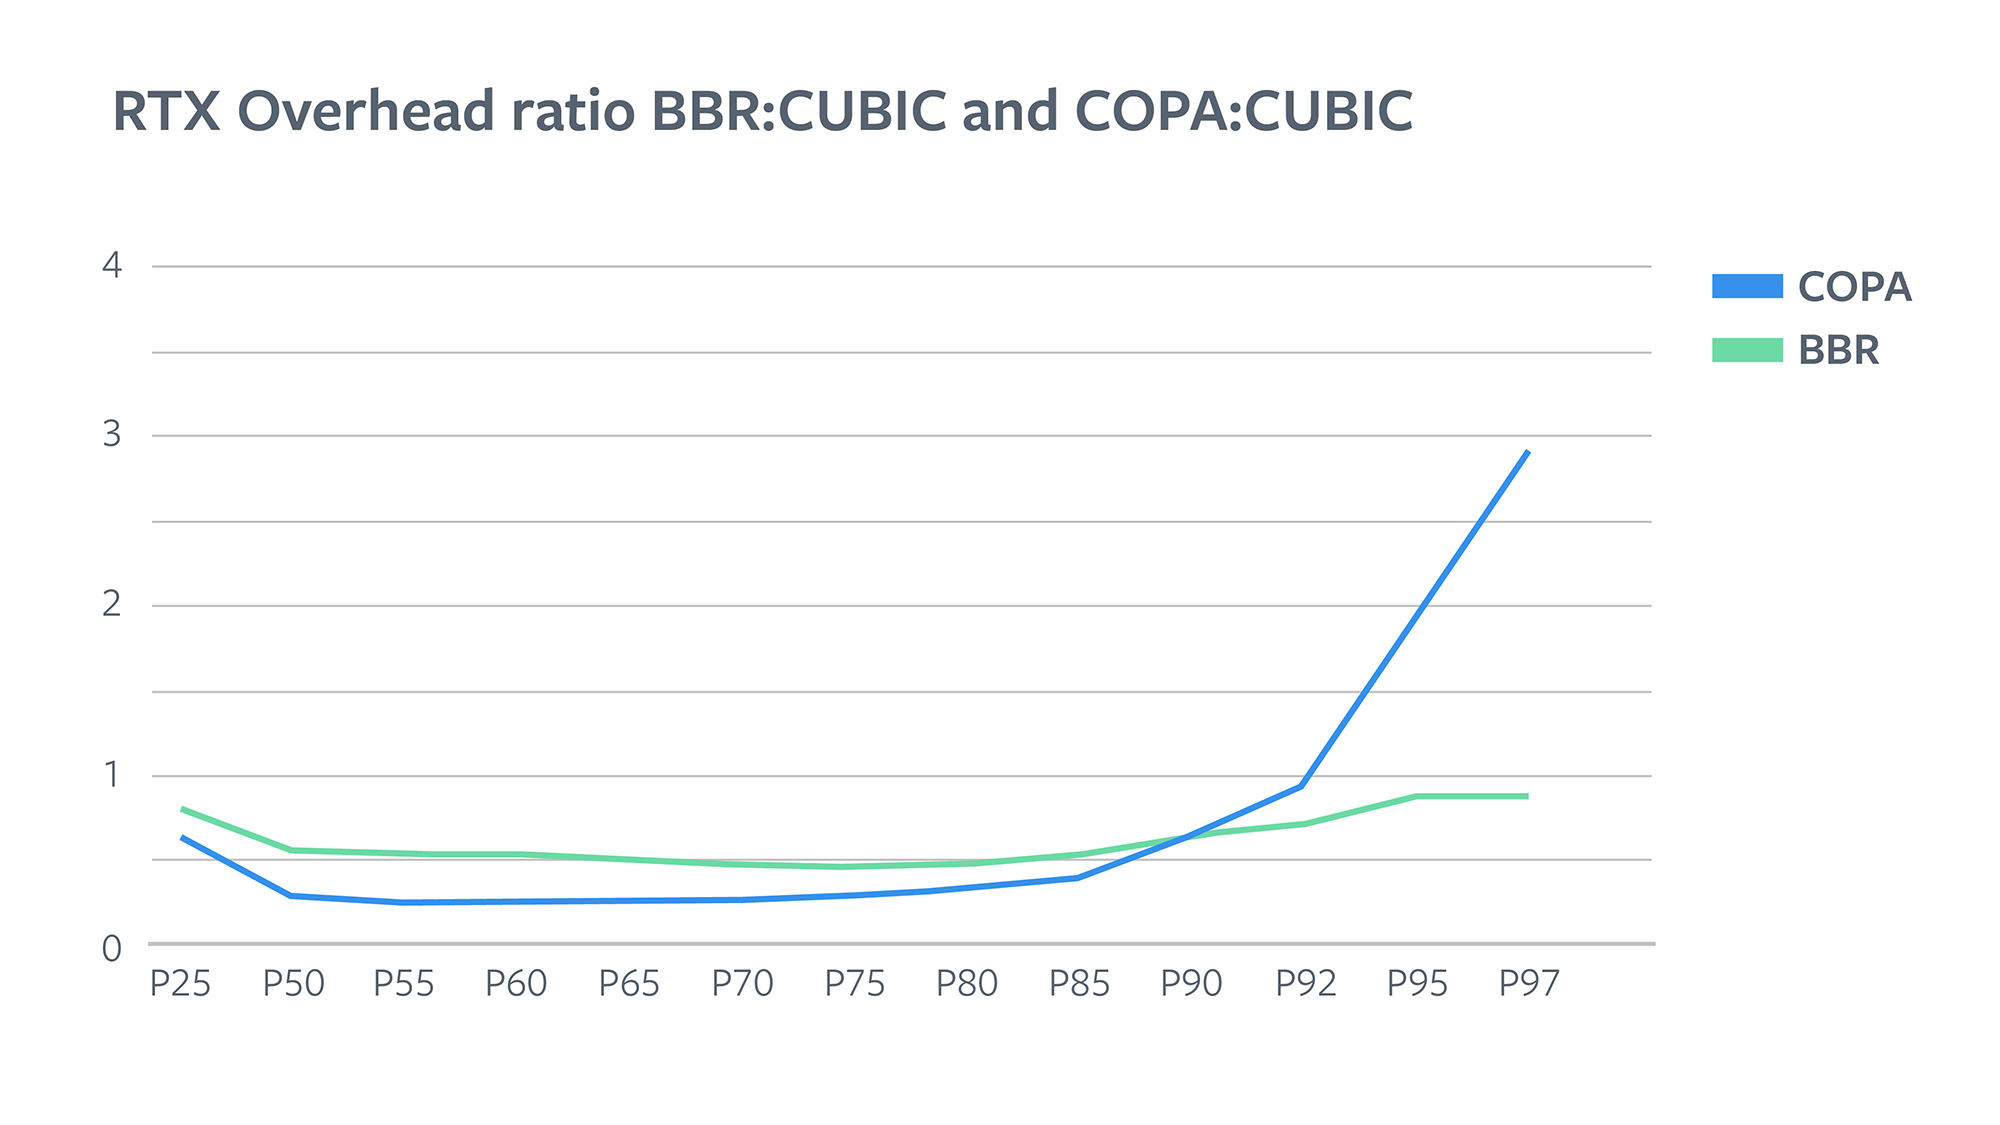
COPA doesn’t treat loss as a signal for congestion; it proactively reduces CWND when it sees an increase in queueing delay. The idea is that as a bottleneck queue fills up, queuing delay measurements done by COPA are going to increase and we can know that there is congestion before we see loss. So, ideally, we should always see much lower packet loss for COPA. It’s indeed what we see for about 90 percent of users. However, the last 10 percent of users saw much more loss, indicating that loss rates and queueing delays were not correlated for these users. We investigated behavior for these cases in more detail and found evidence of network policing, described in the next section.
Possible network policing
Network policing means that the traffic from one source is being isolated and policed to be throttled at a particular rate. In the usual policing method, the provider will tail drop any extra packets that exceed that rate. This results in a few characteristics that differentiate it from losses due to congestion:
- Consistent throughput
- Very high losses
- Lower RTT and queuing delays
Even though the tail retransmission overhead was big for COPA in comparison with CUBIC and BBR, tail RTT was less. This matched some of the characteristics of traffic policing. To confirm, as a first step we broke down the results by ASN, since usually traffic policing varies a lot by ASN provider. We found that RTX overhead indeed varied greatly across ASNs. We found evidence that certain ASNs (in which we found indication of traffic policing in an independent analysis) also had much higher RTX overhead for COPA. To confirm our theory, we plotted the relationship of RTT, queuing delay, and RTX overhead.
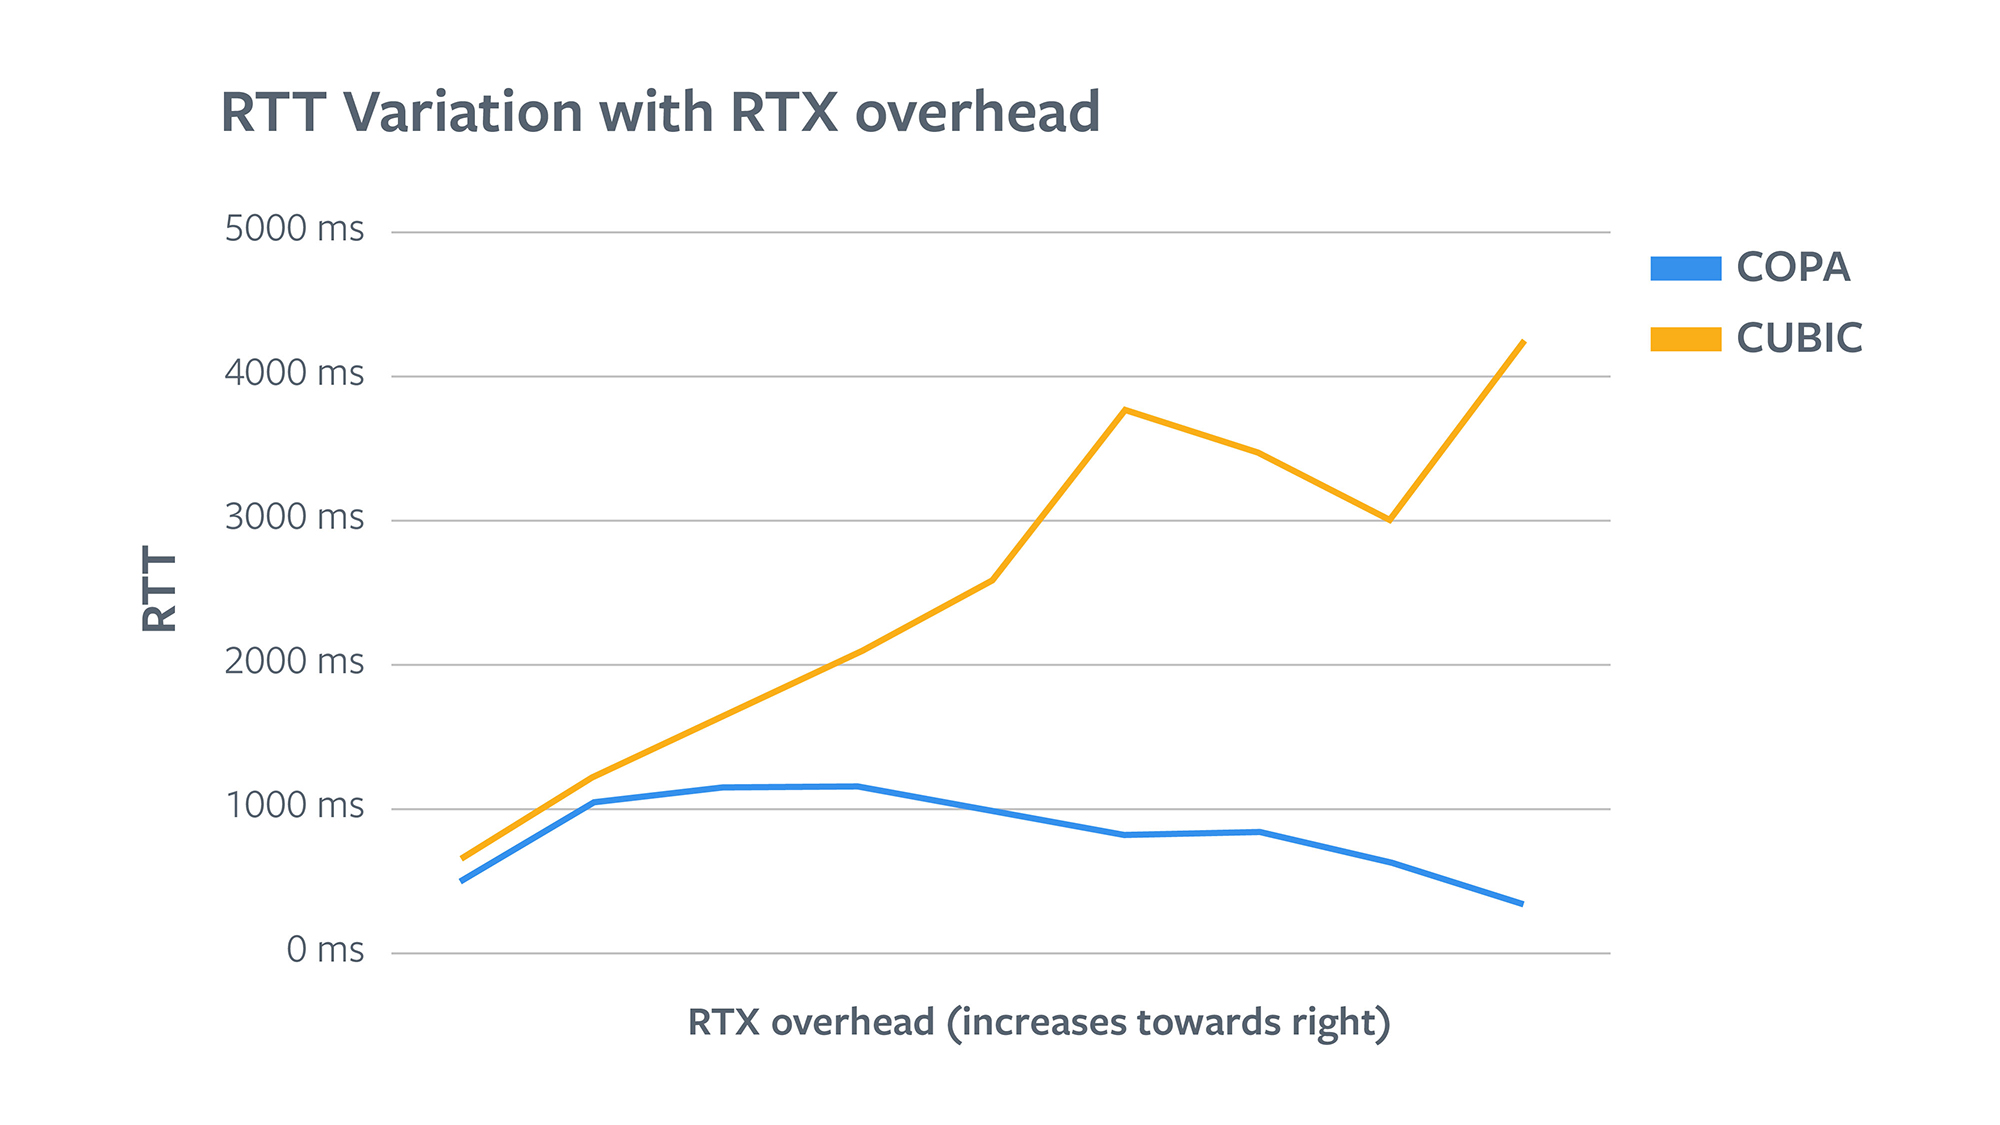
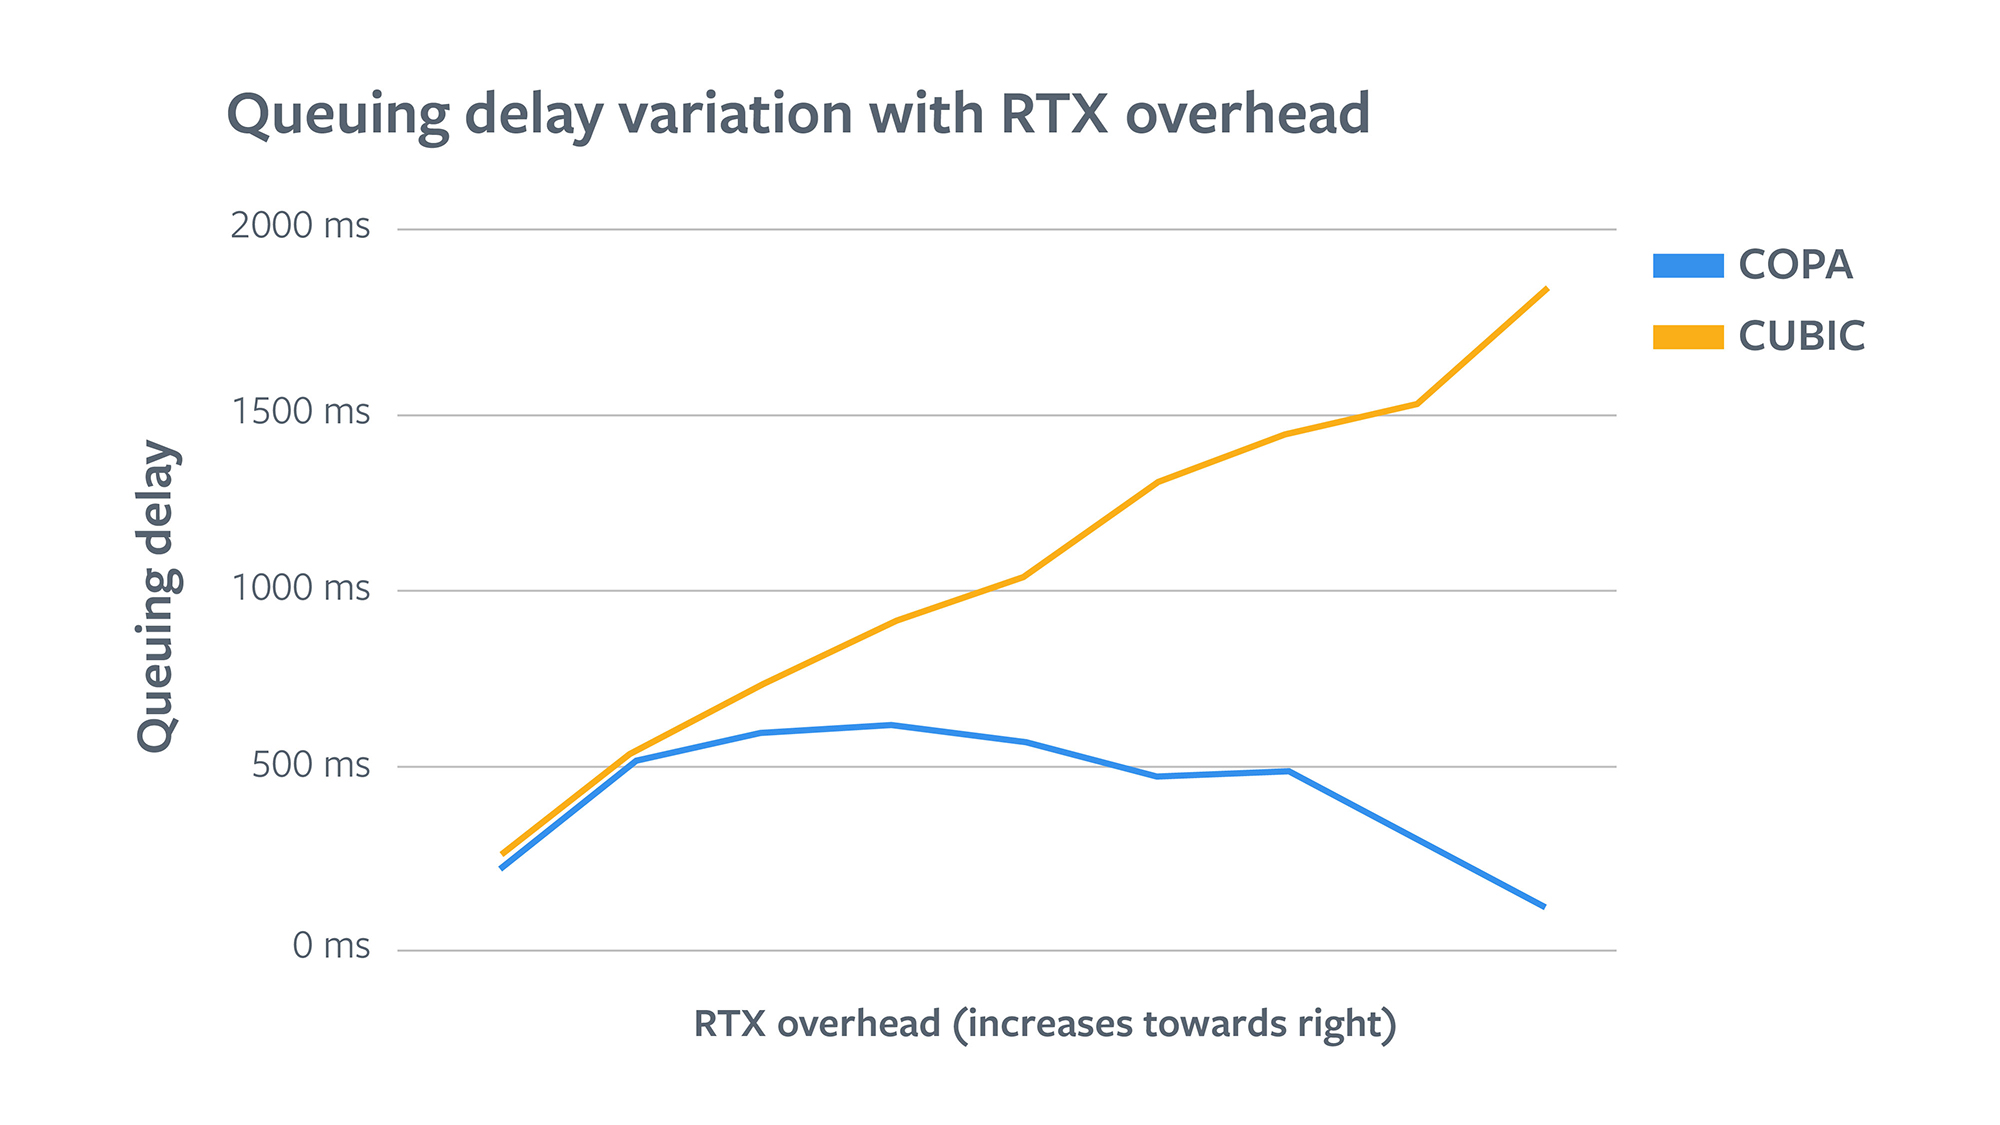
In the first half of the graph we see that for COPA, RTT and queuing delays increase as RTX overhead increases. It shows that in this region the losses are indeed due to congestion as they are accompanied by increasing in queuing delays. But after hitting a maxima, RTT and queuing delays start to go down in the second half of the graph. Users in the highest RTX overhead region actually see very low delays. This confirmed our theory that the high losses are likely due to network policers. Please note that short buffers could also be a reason here, but the network characteristics and solutions are very similar. Whereas for CUBIC, RTT and queuing delays continue to increase as RTX overhead increases. This indicates that that losses for all the users are due to congestion, which makes sense because CUBIC treats loss as a signal for congestion, and it reduces CWND accordingly.
Future work and discussion
COPA has shown promise. The objective function works well, and the dial to control queuing delay vs. throughput trade-off is very attractive. Our tests were on one extreme of the spectrum, i.e., optimization for throughput at very low values of delta. While it was meant to optimize just for throughput, it still reduced queuing delays quite a bit compared with BBR and CUBIC. It’s worth noting that BBR in both our QUIC implementation and the transmission control protocol (TCP) version are undergoing changes and improvements, so it’s possible that this comparison will show different results in the future. As next steps, we are excited to begin experiments to test the other extreme — where the product has a requirement for extremely low latencies, moving us one step closer to having a single tunable congestion control algorithm that can serve varying application needs.
Broader deployment will also require a better understanding of COPA’s impact on competing flows and its TCP friendliness. In our tests, we weren’t able to catch a lot of signals on this aspect. This remains a big part of future work. High RTX cases also showed room for improvement. There are a few possible ways to address it: The COPA paper suggests implementing a competitive mode, in which the delta value changes dynamically based on competing flows and loss. Another option is to implement a heuristic where we reduce CWND based on loss. But there is a risk that it will make COPA react to random losses unrelated to congestion and erode some of the throughput wins. There is also an option to implement explicit detection for network policing, similar to BBR v1. We hope to explore these approaches in the future.
This work was made possible in collaboration with the Video Infra and Traffic Protocols teams. In particular, thanks to Yang Chi and Subodh Iyengar for their help with implementation, and Roberto Peon, Kirill Pugin, Marek Latuskiewicz, Udeepta Bordoloi, and several others for their guidance and support. We’d also like to thank Venkat Arun and Professor Hari Balakrishnan for designing COPA and providing feedback on the experimentation.


