 The Facebook website comprises a diverse set of server applications, most of which run on dedicated machines with 8+ CPU cores and 8+ GiB of RAM. These applications typically use POSIX threads for concurrent computations, with the goal of maximizing throughput by fully utilizing the CPUs and RAM. This environment poses some serious challenges for memory allocation, in particular:
- Allocation and deallocation must be fast. Ideally, little memory allocation would be required in an application’s steady state, but this is far from reality for large dynamic data structures based on dynamic input. Even modest allocator improvements can have a major impact on throughput.
- The relation between active memory and RAM usage must be consistent. In other words, practical bounds on allocator-induced fragmentation are critical. Consider that if fragmentation causes RAM usage to increase by 1 GiB per day, an application that is designed to leave only a little head room will fail within days.
- Memory heap profiling is a critical operational aid. If all goes according to plan, leak detection and removal is a development task. But even then, dynamic input can cause unexpected memory usage spikes that can only be characterized by analyzing behavior under production loads.
In 2009, existing memory allocators met at most two of these three requirements, so we added heap profiling to jemalloc and made many optimizations, such that jemalloc is now strong on all three counts. The remainder of this post surveys jemalloc’s core algorithms and data structures before detailing numerous Facebook-motivated enhancements, followed by a real-world benchmark that compares six memory allocators under a production Web server load.
Note: Please join us on January 11, 2011 for the jemalloc tech talk to learn more about how we are using jemalloc at Facebook.
Core algorithms and data structures
The C and C++ programming languages rely on a very basic untyped allocator API that consists primarily of five functions: malloc(), posix_memalign(), calloc(), realloc(), and free(). Many malloc implementations also provide rudimentary introspection capabilities, like malloc_usable_size(). While the API is simple, high concurrent throughput and fragmentation avoidance require considerable internal complexity. jemalloc combines a few original ideas with a rather larger set of ideas that were first validated in other allocators. Following is a mix of those ideas and allocation philosophy, which combined to form jemalloc.
- Segregate small objects according to size class, and prefer low addresses during re-use. This layout policy originated in phkmalloc, and is the key to jemalloc’s predictable low fragmentation behavior.
- Carefully choose size classes (somewhat inspired by Vam). If size classes are spaced far apart, objects will tend to have excessive unusable trailing space (internal fragmentation). As the size class count increases, there will tend to be a corresponding increase in unused memory dedicated to object sizes that are currently underutilized (external fragmentation).
- Impose tight limits on allocator metadata overhead. Ignoring fragmentation, jemalloc limits metadata to less than 2% of total memory usage, for all size classes.
- Minimize the active page set. Operating system kernels manage virtual memory in terms of pages (usually 4 KiB per page), so it is important to concentrate all data into as few pages as possible. phkmalloc validated this tenet, at a time when applications routinely contended with active pages being swapped out to hard disk, though it remains important in the modern context of avoiding swapping altogether.
- Minimize lock contention. jemalloc’s independent arenas were inspired by lkmalloc, but as time went on, tcmalloc made it abundantly clear that it’s even better to avoid synchronization altogether, so jemalloc also implements thread-specific caching.
- If it isn’t general purpose, it isn’t good enough. When jemalloc was first incorporated into FreeBSD, it had serious fragmentation issues for some applications, and the suggestion was put forth to include multiple allocators in the operating system, the notion being that developers would be empowered to make informed choices based on application characteristics. The correct solution was to dramatically simplify jemalloc’s layout algorithms, in order to improve both performance and predictability. Over the past year, this philosophy has motivated numerous major performance improvements in jemalloc, and it will continue to guide development as weaknesses are discovered.
jemalloc implements three main size class categories as follows (assuming default configuration on a 64-bit system):
- Small: [8], [16, 32, 48, …, 128], [192, 256, 320, …, 512], [768, 1024, 1280, …, 3840]
- Large: [4 KiB, 8 KiB, 12 KiB, …, 4072 KiB]
- Huge: [4 MiB, 8 MiB, 12 MiB, …]
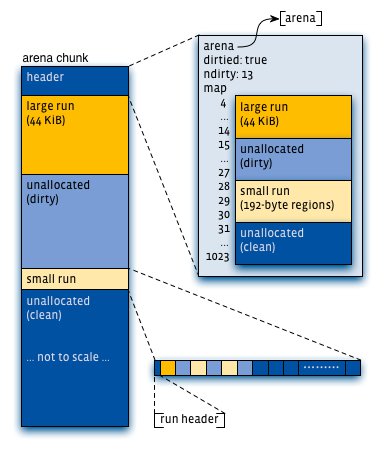
Virtual memory is logically partitioned into chunks of size 2k (4 MiB by default). As a result, it is possible to find allocator metadata for small/large objects (interior pointers) in constant time via pointer manipulations, and to look up metadata for huge objects (chunk-aligned) in logarithmic time via a global red-black tree.
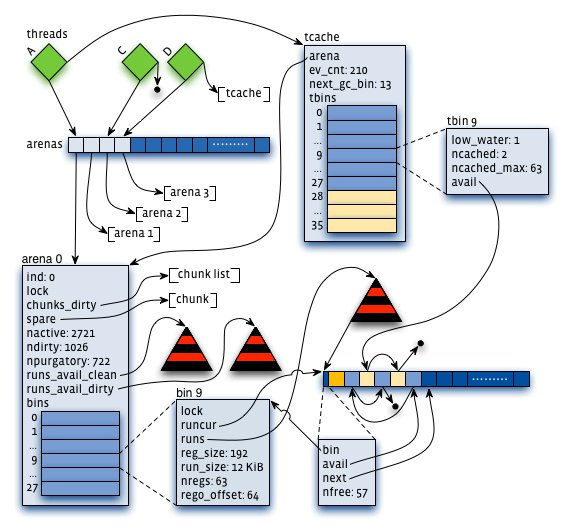
Application threads are assigned arenas in round-robin fashion upon first allocating a small/large object. Arenas are completely independent of each other. They maintain their own chunks, from which they carve page runs for small/large objects. Freed memory is always returned to the arena from which it came, regardless of which thread performs the deallocation.

Each arena chunk contains metadata (primarily a page map), followed by one or more page runs. Small objects are grouped together, with additional metadata at the start of each page run, whereas large objects are independent of each other, and their metadata reside entirely in the arena chunk header. Each arena tracks non-full small object page runs via red-black trees (one for each size class), and always services allocation requests using the non-full run with the lowest address for that size class. Each arena tracks available page runs via two red-black trees — one for clean/untouched page runs, and one for dirty/touched page runs. Page runs are preferentially allocated from the dirty tree, using lowest best fit.

Each thread maintains a cache of small objects, as well as large objects up to a limited size (32 KiB by default). Thus, the vast majority of allocation requests first check for a cached available object before accessing an arena. Allocation via a thread cache requires no locking whatsoever, whereas allocation via an arena requires locking an arena bin (one per small size class) and/or the arena as a whole.
The main goal of thread caches is to reduce the volume of synchronization events. Therefore, the maximum number of cached objects for each size class is capped at a level that allows for a 10-100X synchronization reduction in practice. Higher caching limits would further speed up allocation for some applications, but at an unacceptable fragmentation cost in the general case. To further limit fragmentation, thread caches perform incremental “garbage collection” (GC), where time is measured in terms of allocation requests. Cached objects that go unused for one or more GC passes are progressively flushed to their respective arenas using an exponential decay approach.
Facebook-motivated innovations
In 2009, a Facebook engineer might have summarized jemalloc’s effectiveness by saying something like, “jemalloc’s consistency and reliability are great, but it isn’t fast enough, plus we need better ways to monitor what it’s actually doing.”
Speed
We addressed speed by making many improvements. Here are some of the highlights:
- We rewrote thread caching. Most of the improved speed came from reducing constant-factor overheads (they matter in the critical path!), but we also noticed that tighter control of cache size often improves data locality, which tends to mitigate the increased cache fill/flush costs. Therefore we chose a very simple design in terms of data structures (singly linked LIFO for each size class) and size control (hard limit for each size class, plus incremental GC completely independent of other threads).
- We increased mutex granularity, and restructured the synchronization logic to drop all mutexes during system calls. jemalloc previously had a very simple locking strategy — one mutex per arena — but we determined that holding an arena mutex during
mmap(),munmap(), ormadvise()system calls had a dramatic serialization effect, especially for Linux kernels prior to 2.6.27. Therefore we demoted arena mutexes to protect all operations related to arena chunks and page runs, and for each arena we added one mutex per small size class to protect data structures that are typically accessed for small allocation/deallocation. This was an insufficient remedy though, so we restructured dirty page purging facilities to drop all mutexes before callingmadvise(). This change completely solved the mutex serialization problem for Linux 2.6.27 and newer. - We rewrote dirty page purging such that the maximum number of dirty pages is proportional to total memory usage, rather than constant. We also segregated clean and dirty unused pages, rather than coalescing them, in order to preferentially re-use dirty pages and reduce the total dirty page purging volume. Although this change somewhat increased virtual memory usage, it had a marked positive impact on throughput.
- We developed a new red-black tree implementation that has the same low memory overhead (two pointer fields per node), but is approximately 30% faster for insertion/removal. This constant-factor improvement actually mattered for one of our applications. The previous implementation was based on left-leaning 2-3-4 red-black trees, and all operations were performed using only down passes. While this iterative approach avoids recursion or the need for parent pointers, it requires extra tree manipulations that could be avoided if tree consistency were lazily restored during a subsequent up pass. Experiments revealed that optimal red-black tree implementations must do lazy fix-up. Furthermore, fix-up can often terminate before completing the up pass, and recursion unwinding is an unacceptable cost in such cases. We settled on a non-recursive left-leaning 2-3 red-black tree implementation that initializes an array of parent pointers during the down pass, then uses the array for lazy fix-up in the up pass, which terminates as early as possible.
Introspection
jemalloc has always been able to print detailed internal statistics in human-readable form at application exit, but this is of limited use for long-running server applications, so we exposed malloc_stats_print() such that it can be called repeatedly by the application. Unfortunately this still imposed a parsing burden on consumers, so we added the mallctl*() API, patterned after BSD’s sysctl() system call, to provide access to individual statistics. We re-implemented malloc_stats_print() in terms of mallctl*() in order to assure full coverage, and over time we also extended this facility to provide miscellaneous controls, such as thread cache flushing and forced dirty page purging.
Memory leak diagnosis poses a major challenge, especially when live production conditions are required to expose the leaks. Google’s tcmalloc provides an excellent heap profiling facility suitable for production use, and we have found it invaluable. However, we increasingly faced a dilemma for some applications, in that only jemalloc was capable of adequately controlling memory usage, but only tcmalloc provided adequate tools for understanding memory utilization. Therefore, we added compatible heap profiling functionality to jemalloc. This allowed us to leverage the post-processing tools that come with tcmalloc.
Experimental
Research and development of untried algorithms is in general a risky proposition; the majority of experiments fail. Indeed, a vast graveyard of failed experiments bears witness to jemalloc’s past, despite its nature as a practical endeavor. That hasn’t stopped us from continuing to try new things though. Specifically, we developed two innovations that have the potential for broader usefulness than our current applications.
- Some of the datasets we work with are huge, far beyond what can fit in RAM on a single machine. With the recent increased availability of solid state disks (SSDs), it is tempting to expand datasets to scale with SSD rather than RAM. To this end we added the ability to explicitly map one or more files, rather than using anonymous
mmap(). Our experiments thus far indicate that this is a promising approach for applications with working sets that fit in RAM, but we are still analyzing whether we can take sufficient advantage of this approach to justify the cost of SSD. - The venerable malloc API is quite limited:
malloc(),calloc(),realloc(), andfree(). Over the years, various extensions have been bolted on, likevalloc(),memalign(),posix_memalign(),recalloc(), andmalloc_usable_size(), just to name a few. Of these, onlyposix_memalign()has been standardized, and its bolt-on limitations become apparent when attempting to reallocate aligned memory. Similar issues exist for various combinations of alignment, zeroing, padding, and extension/contraction with/without relocation. We developed a new*allocm()API that supports all reasonable combinations. For API details, see the jemalloc manual page. We are currently using this feature for an optimized C++ string class that depends on reallocation succeeding only if it can be done in place. We also have imminent plans to use it for aligned reallocation in a hash table implementation, which will simplify the existing application logic.
Successes at Facebook
Some of jemalloc’s practical benefits for Facebook are difficult to quantify. For example, we have on numerous occasions used heap profiling on production systems to diagnose memory issues before they could cause service disruptions, not to mention all the uses of heap profiling for development/optimization purposes. More generally, jemalloc’s consistent behavior has allowed us to make more accurate memory utilization projections, which aids operations as well as long term infrastructure planning. All that said, jemalloc does have one very tangible benefit: it is fast.
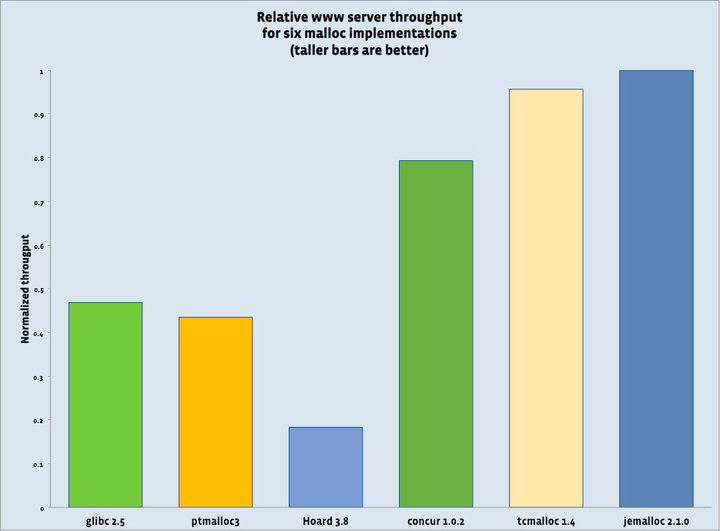
Memory allocator microbenchmark results are notoriously difficult to extrapolate to real-world applications (though that doesn’t stop people from trying). Facebook devotes a significant portion of its infrastructure to machines that use HipHop to serve Web pages to users. Although this is just one of many ways in which jemalloc is used at Facebook, it provides a striking real-world example of how much allocator performance can matter. We used a set of six identical machines, each with 8 CPU cores, to compare total server throughput. The machines served similar, though not identical, requests, over the course of one hour. We sampled at four-minute intervals (15 samples total), measured throughput as inversely related to CPU consumption, and computed relative averages. For one machine we used the default malloc implementation that is part of glibc 2.5, and for the other five machines we used the LD_PRELOAD environment variable to load ptmalloc3, Hoard 3.8, concur 1.0.2, tcmalloc 1.4, and jemalloc 2.1.0. Note that newer versions of glibc exist (we used the default for CentOS 5.2), and that the newest version of tcmalloc is 1.6, but we encountered undiagnosed application instability when using versions 1.5 and 1.6.

glibc derives its allocator from ptmalloc, so their performance similarity is no surprise. The Hoard allocator appears to spend a great deal of time contending on a spinlock, possibly as a side effect of its blowup avoidance algorithms. The concur allocator appears to scale well, but it does not implement thread caching, so it incurs a substantial synchronization cost even though contention is low. tcmalloc under-performs jemalloc by about 4.5%.
The main point of this experiment was to show the huge impact that allocator quality can have, as in glibc versus jemalloc, but we have performed numerous experiments at larger scales, using various hardware and client request loads, in order to quantify the performance advantage of jemalloc over tcmalloc. In general we found that as the number of CPUs increases, the performance gap widens. We interpret this to indicate that jemalloc will continue to scale as we deploy new hardware with ever-increasing CPU core counts.
Future work
jemalloc is now quite mature, but there remain known weaknesses, most of which involve how arenas are assigned to threads. Consider an application that launches a pool of threads to populate a large static data structure, then reverts to single-threaded operation for the remainder of execution. Unless the application takes special action to control how arenas are assigned (or simply limits the number of arenas), the initialization phase is apt to leave behind a wasteland of poorly utilized arenas (that is, high fragmentation). Workarounds exist, but we intend to address this and other issues as they arise due to unforeseen application behavior.
Acknowledgements
Although the vast majority of jemalloc was written by a single author, many others at Facebook, Mozilla, the FreeBSD Project, and elsewhere have contributed both directly and indirectly it its success. At Facebook the following people especially stand out: Keith Adams, Andrei Alexandrescu, Jordan DeLong, Mark Rabkin, Paul Saab, and Gary Wu.


